The field of analytical chemistry encompasses all areas of chemistry itself, incorporating a plethora of tools and methodologies to assay and quantify the physical and chemical properties of different species. This entails measuring their presence (qualitative analysis) and the amount present (quantitative analysis).

Image Credit: Kite_rin/Shutterstock.com
When performing data interpretation within the scope of analytical chemistry, the following questions must be asked: "How well do I know my result?", "What steps in the method, or which device is limiting my knowledge of said result?" and "What should I do to improve my understanding of said result?" To accomplish this requires a great deal of math and scrupulousness.
How to Approach Error and Bias:
All measurements are simply estimates of their true value in nature- the ubiquitous challenge of every analytical chemist. Error and Bias are terms that correlate with the accuracy of a measurement or a set of replicate measurements. It is the term coined for describing how close a measurement is to its true value. When Interpreting data, one should consider the absolute error, the absolute error of the mean, and the relative error of the mean. Taking these elements into account is essential in the function of any analytical chemist.
Two elements contribute to the total error in a system, which are systematic error and random error. The former deals with instrumentation error/calibration and personal error/sampling error. A "true value" is obtained using a standard sample or a calibration standard to account for these errors. Random error is indeterminate and always present. Random error is evident in the inaccuracy of a set of measurements, as is described by the Gaussian Curve.
According to the " Central Limit Theorem, "if one takes these inaccuracies into account, the mean of a large set of measurements may approach the true value, according to the "Central Limit Theorem." This is a pivotal way to increase the integrity of quantitative data interpretation and should be implemented in all measurement sets.
The Gaussian Curve
The Gaussian law of error, sometimes referred to as the "normal law," rests on the nature of error within a given experiment. It asserts that the error in the analysis is the result of many comparable yet independent components and the comparison of frequencies in a series of observations. This law can be expressed mathematically as a function of the mean, (µ), and the variance (ð2):
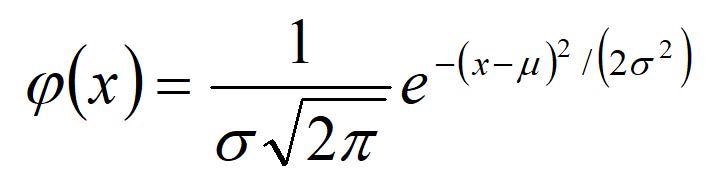
To construct a histogram that shows the Gaussian curve for data, the distribution of data in terms of units of deviation from the mean (x-µ), divided by the standard deviation, is plotted on the X-axis. This is what's known as the Z value. The percentage of measurements is plotted on the Y-axis. By performing these mathematical functions, all curves about the same mean line up on top of one another no matter what the value of ð2. We can talk in very general terms about the fraction (or percentage) of measurements falling within a range about the mean ( µ +/- zð).
Confidence Intervals
Chemists will customarily report their data graphically and display accompanying error bars, employing both the mean and standard deviation. This is done using significant figure convention, meaning the first non-zero digit within the standard deviation indicates where uncertainty begins.
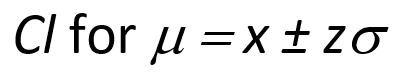
One can establish a confidence interval to report accurate data, however, the mean (µ), or the absolute true value, can never be attained. Confidence intervals allow you to know where the true value lies within a certain degree of probability (excluding systematic error).
Confidence intervals for a single measurement are described below:
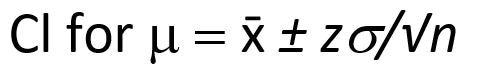
While the confidence interval for n replicate measurements is shown below:
The T-test and the F test
We have discussed how to minimize error, account for uncertainty, and approach the absolute value of a measurement/ set of measurements. This still leaves many aspects of analytical chemistry unaccounted for. For example, to determine how significant and quantitatively varied two sets of data are, one could use the paired T-test or F-test.
If there is a particularly complex set of samples, a researcher might seek to compare his results with multiple assays. To do this, he should calculate/know the mean difference and uncertainty, the standard deviation of the difference, and the number of measurements taken. To obtain the calculated "T" value (Tcalc), the formula is arranged as such:
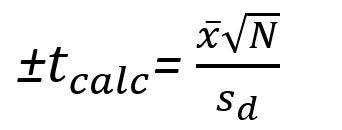
Once this calculated value for T is obtained, the researcher will procure the table of critical "T" values and compare them with the calculated value. If the Tcalc is less than the Tcritical, the null hypothesis is accepted, and there is no significant difference between the two samples/ sets of measurements. If the contrary were true, and Tcalc is greater than Tcritical, the two samples are statistically different.
For the F-test, the data must be analogous in the sense that it encompasses the same random error. This test is very similar to the T-test that was discussed prior. However, this test is based on both the null hypothesis and the ratio of variances. If Fcalc in this case, is greater than Fcritical (obtained from an apropos F-distribution table), then the null hypothesis is rejected, and we see a sign in their different data sets.
Sources:
- K. Esbensen, "Pierre Gy (1924–2015): the key concept of sampling errors", Spectrosc. Europe 30(4), 25–28 (2018). https://doi.org/10.1255/sew.2018.a1
- K.H. Esbensen and P. Paasch-Mortensen, "Process sampling: Theory of Sampling – the missing link in process analytical technologies (PAT)", in Process Analytical Technology, Ed by K. Bakeev. John Wiley & Sons, Chichester, pp. 37–80 (2010). https://doi.org/10.1002/9780470689592.ch3
- Characterizing Experimental Errors. (2020, June 15). DePauw University. https://chem.libretexts.org/@go/page/220677
- Kwak, S. G., & Kim, J. H. (2017). Central limit theorem: the cornerstone of modern statistics. Korean journal of anesthesiology, 70(2), 144–156. https://doi.org/10.4097/kjae.2017.70.2.144
Further Reading