Produced in Partnership with PerkinElmerSep 7 2022Reviewed by Olivia Frost
In this interview, PerkinElmer, talks to AZoLifeSciences about how you can go about improving your canna-business.
Could you please provide us with a brief overview of your new LC 300 UHPLC system?
The new LC 300 system is an easy-to-use instrument with the flexibility to meet your needs; it is a wide portfolio of detectors and brand-new streamlined software.
When it comes to advantages, the first of these is that it is easy to use. Among other things, the LC 300 has a built-in column oven. This means that instead of having an external column - which the LC 300 also has - there is the instrument; instead of a whole second system, everything is built within the autosampler, and it is even easier to control your temperatures and things like that within the software itself.
What are the advantages of the LC 300?
It is easy to see the metrics you need to monitor at one quick glance: either in the middle of a run or in general, whether the instrument is operational. Another big thing that we have added to the new system is an integrated waste and power module - which means that in addition to running the waste in a nice cleaner capacity (down the side, into the waste module, and then out to the solvent waste on the back of it) there are actually a few spots for plugs for the other modules on the back.
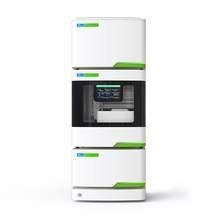
Image Credit: PerkinElmer
This means that the pump, the autosampler, and the detectors all plug into the power module, and the power module itself plugs into the wall. There is a single button right on the side of the power module that allows you to turn the entire stack off with one switch, which both myself and our users really appreciate.
Furthermore, unlike a mass spec, you can turn your LC on and off at the end of the day. It is also straightforward: the user does not have to go around the back and flip off each individual switch on each module. Having a streamlined instrument and software really facilitates the ease of use of the LC 300.
Thanks to our range of options, it is also a very flexible instrument, allowing users to adapt it to meet their needs. The options include an HPLC and a UHPLC, so depending on whether the user needs to go up to 10,000 PSI or even up to 18,000 PSI, the LC 300 covers all the different LC needs they might need.
Our autosampler also has two different availabilities: in Peltier or non-Peltier. This means that if you do not need to cool or heat your sample, a standard auto-sampler allows you to sample your injections without needing a manual injection.
The Peltier system also applies if you need to go from 4 to 40 degrees Celsius: hold your samples within the actual autosampler and ensure they stay within the proper temperature range. As we mentioned earlier, the product also has a built-in column oven, but larger columns – up to 30 centimeters in length – can be fitted in an external column oven.
In addition to fitting larger columns, this external column oven also can come with a six-port column selection valve. There are also different options in the hardware. Furthermore, since our last system, we have added a lot of different detectors to the mix – but we have retained our best-in-class PDA detector. Within those detectors are a range of UV/Vis options: a single channel UV/Vis, and a multichannel UV/Vis, if you want to monitor up to eight different wavelengths simultaneously.
The PDA has been improved slightly but has kept the bulk of its best-in-class design, including tool-free maintenance, easy serviceability, and its general overall quality – including very high signal-to-noise, wide linear dynamic range, and a high data rate and accuracy.
We also have introduced a fluorescence and refractive index detector to our portfolio, which is great for those other needs. While most people use UV/Vis as a detector for LC, there are other options.
Could you describe the SimplicityChrom system and what it does?
Simply put, we think you will love SimplicityChrom. Our new software, SimplicityChrom, is a brand-new CDS built from the ground up. It is simple and innovative and has enhanced security. While this is not related to this software, the LC 300 will also have third-party drivers for other CDSs.
SimplicityChrom enables you to complete your data processing and instrument control needs in one easy-to-use workspace environment. Suppose we were to jump over to acquisition. In that case, SimplicityChrom allows creating customized layouts and workflows to meet the user’s specific needs, allowing you and your team to rearrange and save workspaces easily.
Within the acquisition mode, the user can toggle many different windows on and off between your position method and your sequence, your run queue, a live feed from the chromatogram, or the chromatogram from your detector. There are, therefore, a lot of edits that the user can make, depending on their preferred presentation metrics when acquiring or reviewing data.
It is a very innovative software that we’re presenting on a single screen. You can also view data tables and chromatograms for a given analyte or a set of analytes across multiple samples. This allows the user to identify trends, save time, and perform more efficient data analysis. If the user has a PDA detector, they can view spectral data, opening up a whole other realm of processing power with which they analyze and scrutinize their data.
The windows and workflow utilized within this screen are also customizable, allowing the user to view as many windows as they want. Alternatively, they can narrow it down to several specific to their own data processing needs.
SimplicityChrom is a streamlined software: it is tailor-made for high-throughput analysis, even in compliant environments. With the enhanced security features, managers can customize user and group access directly in the CDS platform. This, therefore, mitigates any unnecessary IT challenges that are often associated with trying to create different authorizations for different people. From setting up users in group roles; to acquiring data; to processing: it’s all there in one streamlined piece of software.
Could you explain more about potency testing as it relates to cannabis and hemp?
When we talk about potency testing, as it concerns cannabis and hemp, we are talking about analyzing samples and quantifying the cannabinoid compounds that may be present. Cannabinoids are the main biologically active components of the cannabis plant.
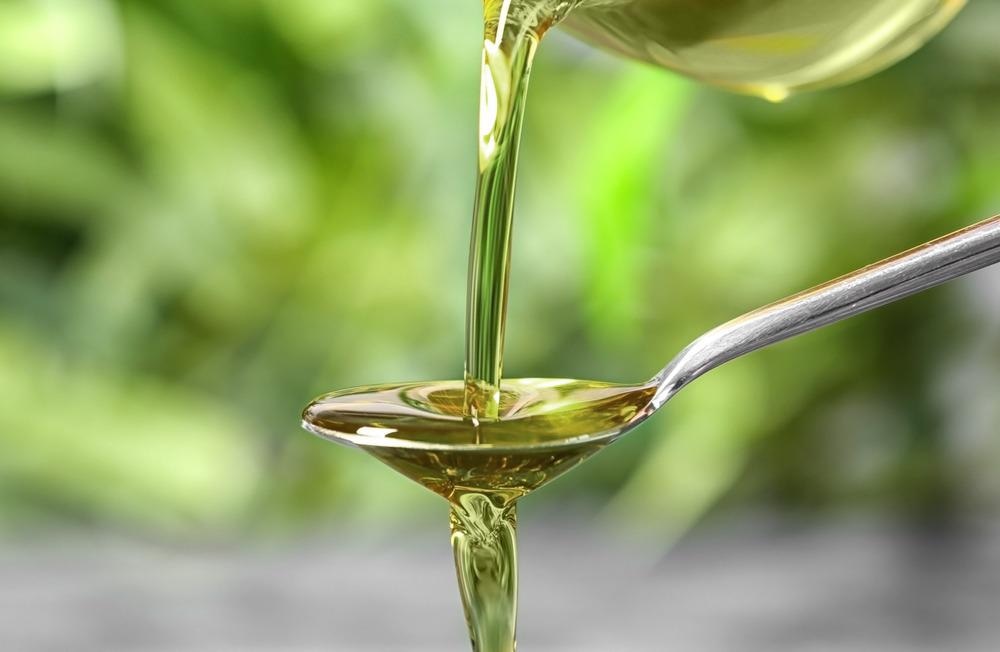
Image Credit: ShutterStock/New Africa
They form a complex group of closely related co
mpounds of which there are well over a hundred known, and only a few are well-described, and we have studied them in more detail. Of these, the primary focus is arguably Delta-9-tetrahydrocannabinol or D-9-THC. This is also the compound people are referring to when they mention THC.
What is the significance of THC?
THC is the primary focus and active ingredient due to its pharmacological and toxicological characteristics. Essentially, it is the one that has the intoxicating effect of making the user high. Strict legal limits have been enforced upon this particular compound, but other forms of THC are present albeit minimally, such as D-8 or D-10.
The most notable one is THCA, the naturally occurring precursor to D-9-THC. THCA, while readily found in high concentrations in flowers, will readily decarboxylate and convert to D-9-THC during a typical process of utilizing this plant (either by drying or heating it).
There are many medicinal attributes to many of these cannabinoids like THC. The one most people have heard the most is cannabidiol, or CBD. While many studies have been carried out, more still need to be done.
From what we have seen so far, many medicinal benefits could come from many of these compounds - from easing the pain of multiple sclerosis or nerve pain in general to reducing anxiety, nausea, and vomiting. Studies have shown that it can be used as a muscle relaxant to help with symptoms of Parkinson’s disease. Monitoring not just THC but all of these cannabinoids can be important and will become increasingly so as more of these compounds are studied and may prove medicinally beneficial.
Why should organizations bother with potency testing in general?
At this stage, we are trying to treat cannabinoid potency more and more like a pharmaceutical. They are active ingredients, and they should be thoroughly and accurately labeled. The first reason for this is to allow customers to make well-informed decisions.
The ratio of these cannabinoids relative to each other within the plant, oil, or extract, along with a particular terpene profile, is what causes or creates many of these therapeutic effects.
As we learn more and more about these compounds, it is important to have the proper analytical procedures already in place to quantify more of these cannabinoids present accurately. This can lead to more confident product labeling and composition, which is essential to helping to assure the safety of those end products and further improving the standardization of this industry.
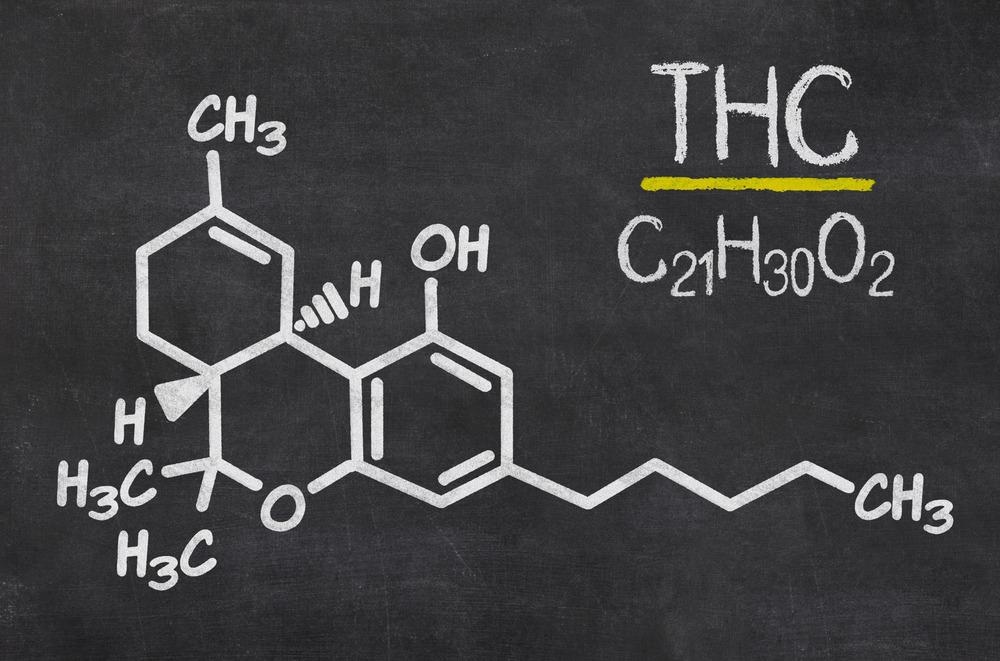
Image Credit: ShutterStock/Zerbor
Another critical note right now – and another reason it is essential to classify THC - is that hemp is federally legal while cannabis is not. In America, it is state-specific. So, suppose you want to be able to ship a particular product over state lines or provide a service lab contract to specific regions. In that case, this is a significant legal hurdle to keep in mind if they’re not within your state or region, as it would be illegal to transfer the product over state lines.
According to the FDA, the classification difference is that hemp should contain 0.3% THC by weight or less, which is an incredibly small amount.
Therefore, it is essential to keep in mind that, in addition to all these other cannabinoids, THC is the main legal hurdle right now.
So, moving on to the actual potency testing itself, what we are trying to achieve here is, again, this label claim accuracy, similar to pharmaceuticals.
How is the THC calculated?
For example, if a product is labeled with a THCA concentration of 23.2% by weight, D-9-THC is 1%, and the total THC is 21.35%. If you do some pretty quick math, it might be clear that this does not add up.
The reason is that we often report these values in percent by weight. When THCA converts THC - as they are different molecules - it loses some of its mass. This means that you need to account for that difference when calculating the total THC because THCA will readily convert to THC in either these products being made, upon ingestion, or smoked in any way.
It is essential to consider the molecular weight of the THCA and the molecular weight of the THC and ensure you are doing that conversion. In this case, it happens to be about 87.7%: THC weighs 87.7% of THCA; so when you have an amount of THCA, that must be multiplied by that 0.877 to get an equivalent amount of THC. Finally, you add those two numbers together, giving you the total THC composition that could be present in the sample.
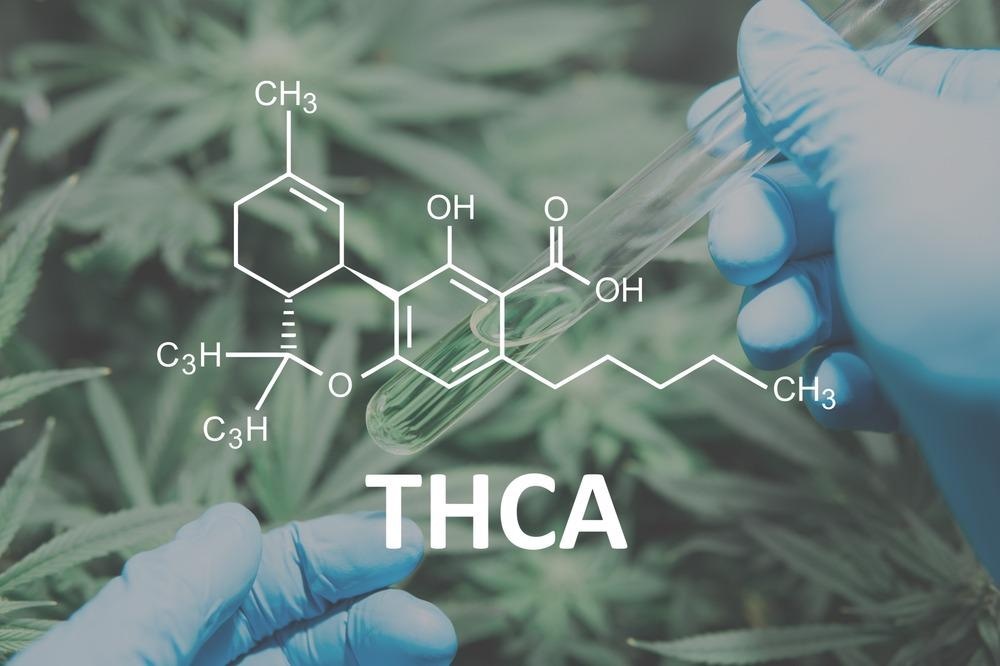
Image Credit: ShutterStock/Dymytro Tyshchenko
To briefly return to the example given above, you would simply multiply 23.2 by 0.877, which equals 20.35, before adding 1% of D-9, which results in 21.35%. That’s how it’s calculated!
There are a couple of other ways you could do this. Of course, the first method would be the simplest: you just take the percent of THCA and add it to the percentage of THC.
However, that approach grossly overestimates the amount of THC in the mix. It is the simplest but is the least accurate. Then, we can move on to method two, which is the one that our organization uses and the one that most others use: though still a little off in accuracy, it is pretty accurate. The important note is that it’s totaling the potential THC.
Then there is method three, which could theoretically get you the most accuracy, but the drawback is that more and more math is added to the process. It is a little too much for our purposes - especially considering method three is still an estimate. In reality, as we have talked about, THCA will convert to THC. However, it is not a hundred percent efficient: on average, about 75% of the THCA will convert to THC from heating.
That can still vary by flower and strain and method of processing you are doing to it, rather than trying to obtain the most accurate calculation. We calculate the maximum potential THC, put that on the label, and that way, our calculations are more straightforward - but they are still accurate to what is in that flower.
There are many other cannabinoids than just THC. We are not monitoring all 100+ cannabinoids, of course: each lab can pick and choose which ones they want to monitor, but just like THC, it is essential to calculate the true totals of these cannabinoids.
To do that, you should be summing up all the forms of that given analyte. Essentially, in all the cases, there is a normal cannabinoid; then we might call an acidified form of it – for instance, consider CBD, CBDA, THC, and THCA. You will need to combine those, just like THC. There will be a mass difference associated with all of them.
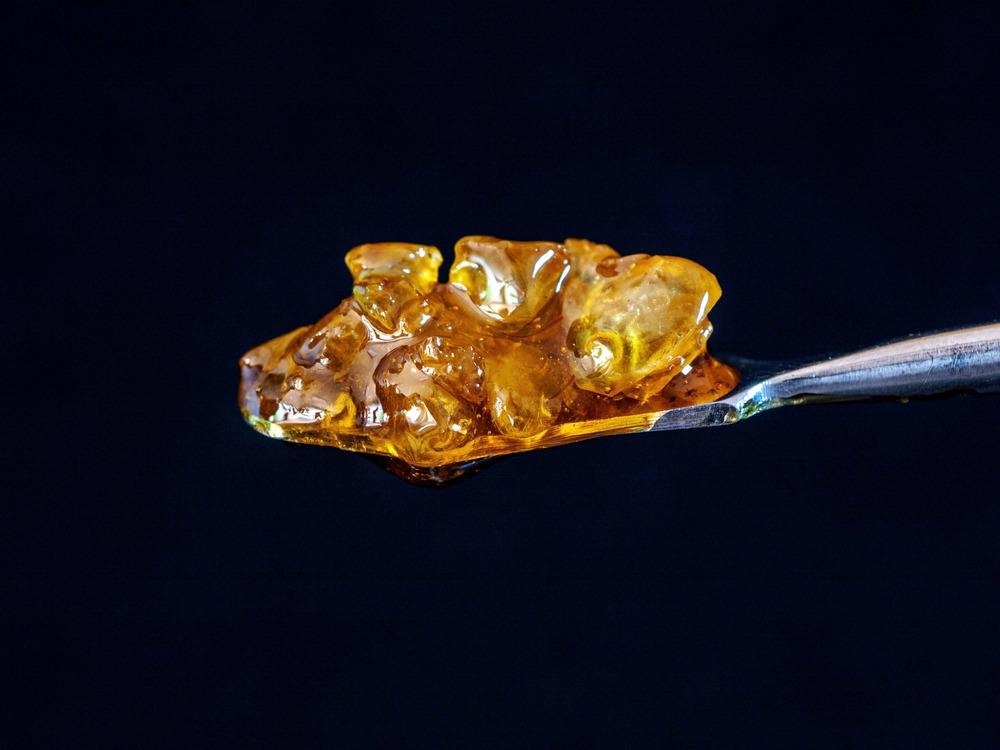
Image Credit: ShutterStock/BenLJohnson
Of course, these are all very similar compounds - so they all typically measure at around 0.877. In the case of THCA and the THC, it’s 0.87717. CBA to CB is 0.87723. So, we are rounding up to 0.877 to make it easier. Some of the others are also very close, but you must add the two together and remember to account for that mass difference.
Again, the lab or grower – or whoever is doing this analysis – can choose which cannabinoids we monitor, but our current methodology offers up to 16 of the most prevalent cannabinoids. When you look at the complete list, you will notice that THC, CBD, and others are all included.
This knowledge can then allow you to look at the results and potentially notice a presence of something like CBGA combined with a low abundance of CBG, which, if found, could mean that the plant was immature. If this happened, you could tell the farmer that you might have harvested your plant too soon.
In addition to quantifying these compounds to know how much is in there, you can also better understand the plant and the procedures of collecting and harvesting themselves. This is just another benefit of doing this potency testing.
How do you test the potency of cannabis or hemp in a plant?
This can be done in a few ways, but the simplest method is to use an HPLC system with a PDA detector. In addition to an app note, which is available to the public, our organization also has an improved set of guidelines given to anyone who purchases an instrument.
This set of guidelines walks the user through what supplies to order from us, what other vendors you might need parts from, and their part numbers, as well as explains how to set up, analyze and process a full potency method from A to Z, as well as providing optimum sensitivity for each and individual analyte.
It also includes an improved linear dynamic range for those samples that are higher in THCA and CBDA, which is starting to become more and more common in some of these newer hybrid strains of flower.
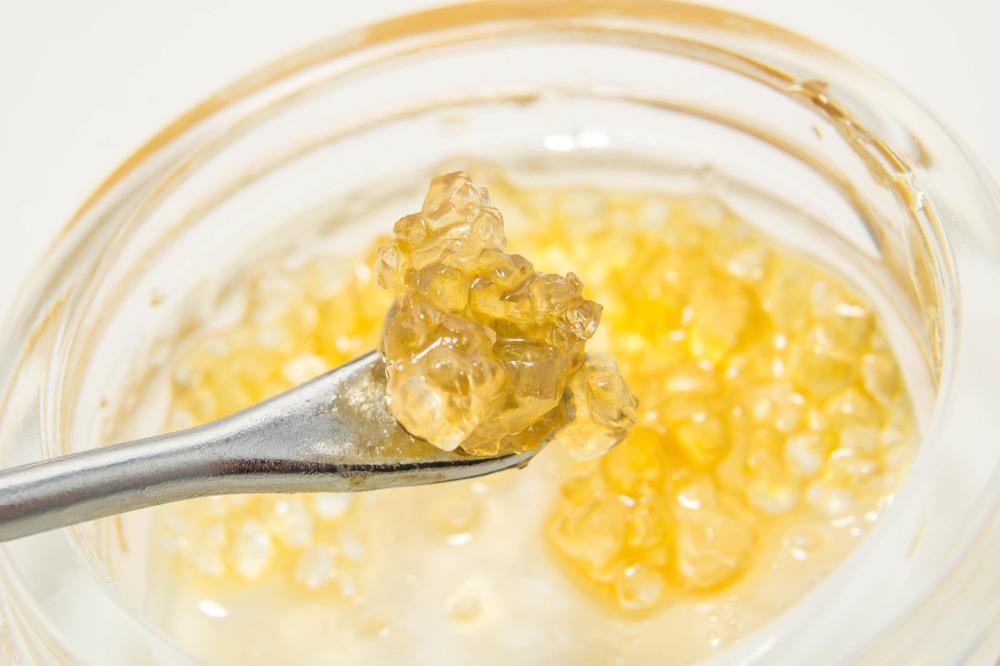
Image Credit: ShutterStock/Brandon Crawford
More broadly, we are monitoring 16 cannabinoids with an HPLC system. In our case, we use the column called an SPP column or superficially porous particle. An SPP column gives you near UHPLC resolution but at HPLC pressures. So, because we have an HPLC instrument, this is going to reduce the cost of the system itself.
There is usually a little more preventative maintenance associated with UHPLC because of the smaller inner diameters, the smaller tubing, etc. Furthermore, because we are using an SPP column instead of a regular analytical column, this is going to allow us to have a quicker analysis, which also then saves costs in the long run.
How is a PDA used for the detection?
PDAs - or a photodiode array - are essential for method development. However, even if you have your method set, they are still great for that extra validation of results, especially for troublesome or dirty samples, which cannabis and hemp are.
You can use things like library match confirmations, peak purity measurements, and spectral comparisons to determine if you have some anomalous results, among other measurements that are specific to the PDA.
Identification of a contaminant can therefore be facilitated, which can be seen through the spectral properties in the measurements. A PDA can therefore be helpful, but as part of the method, we also use a single wavelength and get results that are almost as good but still well above the threshold requirements we need. The PDA allows you to obtain the most sensitive results because you can start doing wavelength programming and things like that.
What are the biggest considerations to keep in mind when analyzing a dried flower?
The two biggest considerations to keep in mind when analyzing a dried flower are sample prep and the LC methodology itself.
In a typical workflow, you would take your dried flower sample, and homogenize it by grinding or vortex. And then extract it via some sort of solvent; It is a very quick and simple process.
In our case, we have found that about 15 milliliters of solvent per gram of flower seem to suffice for a good extraction. Using only a couple of grams of sample usually gives enough to analyze multiple times if necessary. How much you dilute beyond that might be necessary for higher concentrations, more likely in extracts and oils than flower, but that dilution factor will affect the range with which you can quantify within.
Is there a standard practice for collection?
As of now, there is not really standard practice for the collection, which is a big problem.
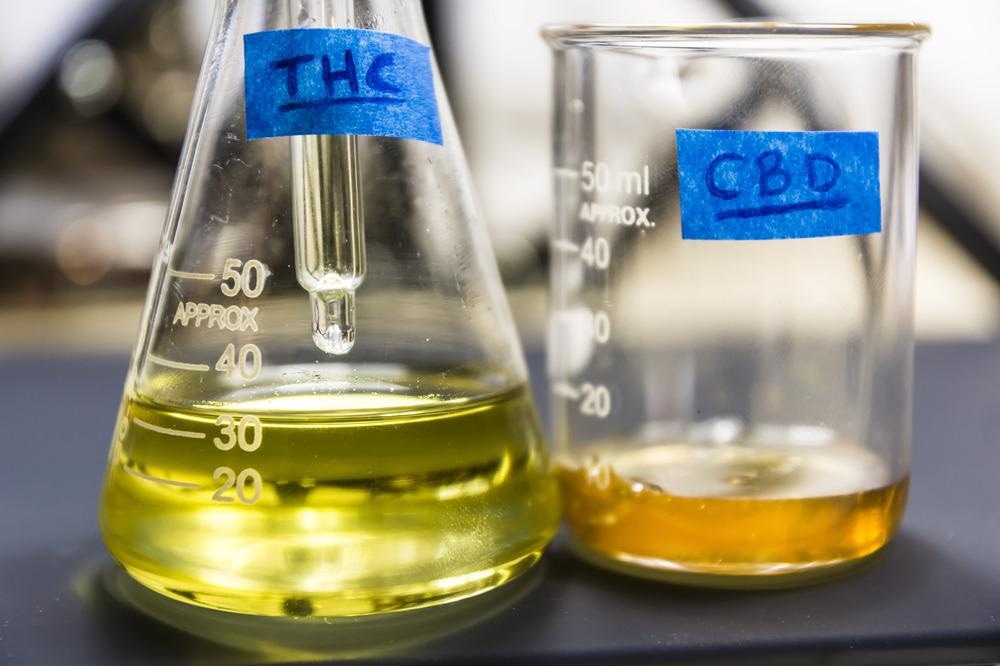
Image Credit: ShutterStock/Mitch M
The more comprehensive your collection and analysis, the more consistent, accurate and precise your results will be. So you should be collecting from multiple areas of a plant if possible, or at least the areas of higher THC concentration since that is such a big part of this test right now.
What are the main ways to pulverize the samples into the powder for extraction?
As mentioned, we often do a percent by weight. So if you have too much water left, that will affect the percent by weight. Homogenizing the samples is vital for reproducible results.
We have tried numerous ways to homogenize and pulverize these samples into a powder for extraction, such as expensive grinders as well as less expensive grinders. We have tried stainless steel ball bearings inside of a tube and shaking it or vortex it like crazy. We have tried frozen versus room-temperature flowers. We have tried extracting then vortex. We have tried doing both at once with the solvent already in there with the ball beads.
Most of the methods seem to work to some extent. But what we eventually got to - and what a lot of customers like - is dry-grinding it upfront, weighing, and then performing your extraction and filtration.
What does the OMNI Bead Ruptor Homogenizer offer to the market?
Not only is it good for flower samples, but it is also really good for edibles and oils and other things like that. It does all of the above, but users just need to make sure that you’re doing it consistently and making sure that you’re getting a nice homogenized sample.
The finer the sample, the better the extraction is going to be: because you just have more surface area for the solvent to then extract from and make sure it is consistent. Consistency is key.
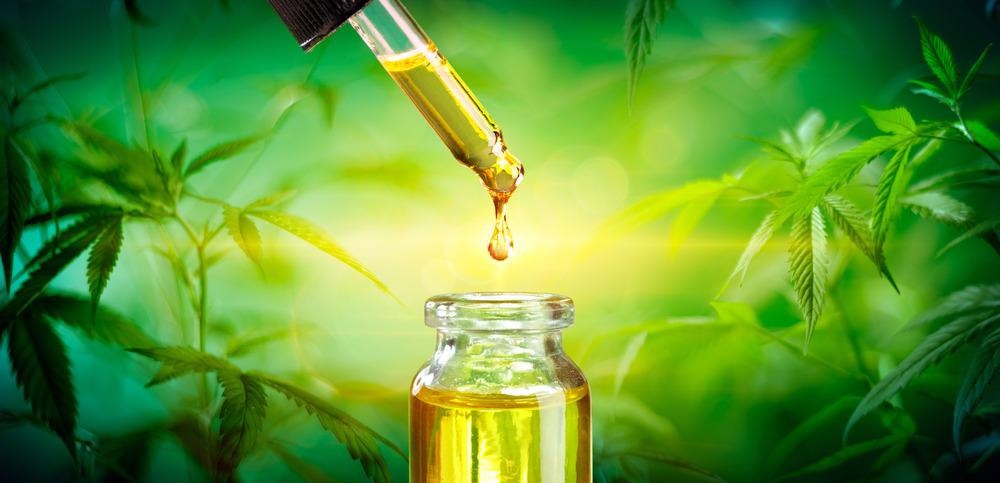
Image Credit: ShutterStock/Romolo Tavani
For most of these, you are probably getting close to a hundred percent extraction - at least for the flower.
So, if you have an efficient process - or a consistently efficient process- that is really the key to making sure that your results are continually precise and accurate.
Considering the LC method itself, there are many parameters that can be changed to achieve optimal separation and resolution in your chromatogram. The column you choose is a huge part of what type of separation can be achieved, as well as the stationary phase in that column, as it can determine which analytes will be retained longer. So, the size and dimensions of your column will initially determine analysis time, peak shape, resolution, and things like that. But these factors will also be affected by the other parameters as well.
What system does PerkinElmer use, and what are the reasons for this?
Small changes can equate to large alterations in the chromatography you can achieve.
In terms of where we landed with our method: we chose an HPLC column, meaning the particle size is large enough that the back pressure created only requires an HPLC grade system to run this analysis. When you get to a certain small size, typically about two microns or less, you can get into UHPLC level resolution and pressures.
As mentioned earlier, using a column like an SPP column helps bridge that gap between the UHPLC level quickness and resolution without the pressure typically associated with that small of a particle size in the column, which is why we went with that for this application. Essentially, the higher the number, the better the resolution. If you notice the trend, the larger the particle size, the lower the resolution.
Within our column, we are using a 2.6-micron particle size: if it were not an SP, this particle size would get you somewhere between the 2.2 and the two-micron resolution, but because of the SPP particles and the way they are packed (and the way they allow the mobile phase and analytes to run through them) you are actually getting resolution closer to on par with sub-2-micron, or UHPLC level columns.
This is why we went with that option. Another factor that needs to be kept in mind is the elution type. So, you have isocratic, and you have gradient. Essentially, we decided to go with isocratic because it is simpler and it is a little more ideal in general. The mobile phase composition itself is also vital to achieving optimal resolution based on the type of chromatography you plan to perform and the analytes you wish to separate and analyze.
Ours is a pretty simple system comprising of an aqueous in an organic phase, but we have added ammonium formate to the aqueous mobile phase to improve resolution. The last few things to keep in mind are the oven temp, the injection volume, and the wavelength.
The oven temperature can help to improve the speed of the chromatography: the higher the temperature, the less pressure on the system since the mobile phase can move through the stationary phase more easily. You have to make sure that you are not sacrificing resolution by increasing the speed too much. This means that it is a give-and-take between a high-enough temperature without sacrificing that resolution. Injection volume can help improve peak shape and elution times or can be used to save sample for those that are more limited or finite and supply something like blood.

Image Credit: ShutterStock/Tsareva.pro
When it comes to cannabis, it is relatively easy to get a lot of sample from a small amount of flowers.
We have made a number of major revisions over the last year or so. Firstly, the elution method was switched from gradient to isocratic. The ammonium formate was added, and the concentration was very specifically formulated for the separation of these cannabinoids, and the wavelength might be modified to a program to increase the sensitivity of certain analytes.
About PerkinElmer Cannabis & Hemp Testing Solutions
 With the cannabis and hemp markets continuing to grow rapidly and regulations strengthening, labs increasingly need streamlined access to best-in-class testing solutions geared toward the unique requirements of the industry. Whether your lab is well established or just starting up, PerkinElmer is a single-source vendor for instruments, methods, reagents, and consumables on hand to help enhance your testing capacity and get ahead of the competition.
They help drive analytical best practices and operating procedures and commit to ensuring your laboratory has maximum uptime. Learn about their various instruments, testing methods, and applications for cannabis analyses. Let them work with you to build an efficient workflow, so you can focus on growing your business.
 The analysis of pesticide residues in cannabis and hemp products