Over the past decade, there has been astronomical growth in the medicinal use of cannabis and cannabis-related products. There are now legal cannabis markets in Columbia, New Zealand, Germany and Canada.
There are 30 states in the USA, as well as the District of Columbia, that have passed legislation permitting the use of medicinal cannabis. Nine of these 30 states have laws permitting the use of recreational cannabis.
The industry moving towards legitimization means that there is a greater need to understand cannabinoid concentrations during the cultivation and processing path. This is critical to assure the safety and quality of cannabis products.
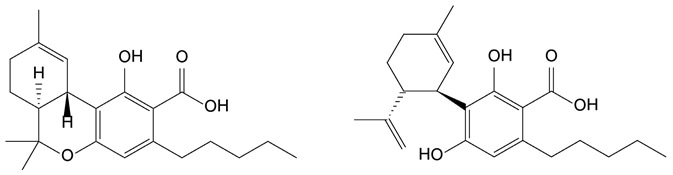
Figure 1. Chemical structures of the two predominant cannabinoids THCA (left) and CBDA (right). Image Credit: PerkinElmer Cannabis & Hemp Testing Solutions
Cannabis flower potency is usually determined by the concentration of the two predominant cannabinoids: cannabidiolic acid (CBDA) and tetrahydrocannabinolic acid (THCA)(shown in Figure 1).
This potency metric influences the valuation of the flower. This means that it is of economic importance to all stakeholders in the cannabis supply chain to have a reliable and accurate determination of potency.
Potency has historically been determined through the use of high performance liquid chromatography (HPLC). There are several disadvantages to using HPLC despite the fact that it provides a full cannabinoid profile.
It is unable to be used directly at grow sites because of longer sample preparation times, hazardous chemicals, complex instrumentation and sample destruction. Cultivators looking for a non-destructive and rapid process have begun to seek a user-friendly and faster alternative to HPLC.
One alternative technique is Fourier transform near-infrared (FT-NIR) spectroscopy. FT-NIR has been used in a wide range of applications for both quantitative and qualitative determination of analytes on the percent level because it is a robust and remarkably versatile analytical technique.
This article will present FT-NIR spectroscopy as a cost-effective and rapid tool for the quantitative determination of potency in dried cannabis flowers.
FT-NIR Measures the Chemical Composition of Substances
FT-NIR utilizes energy in the region of the electromagnetic spectrum to elucidate sample chemistry: 14,000 – 4000 cm-1, or 714 – 2500 nm. The chemical bonds of a sample absorb light at discrete wavelengths when the sample is irradiated with near-infrared light.
Information about the chemical bonds present in the sample is gained by studying the resulting spectrum. FT-NIR allows users to chemically fingerprint substances and, when calibrated correctly, yields quantitative results.
Potency Determination By FT-NIR Poses a Unique Challenge
Botanicals are heterogeneous by nature; this category includes cannabis flowers. This structure creates a unique challenge because it means that the cannabis flower is a complex matrix consisting of over 500 naturally produced chemicals and a variety of plant tissue types.
The distribution of these chemicals can also vary greatly within individual flowers, over an individual plant and between plants of the same cultivar.1 This means that every part of the cannabis flower is different and is likely to vary greatly in its cannabinoid content when compared to another part of the plant.
It is, therefore, of great analytical importance to have a technique that can overcome the inherent heterogeneity of the cannabis flower to ensure a representative and accurate measurement of flower potency.
Due to the relative insensitivity to scattering effects and high penetration depth of NIR light, the FT-NIR is ideally suited for the analysis of heterogeneous substances.
A large sample volume is irradiated with NIR light through the use of the Sample Spinner using the Near-Infrared Reflectance Module (NIRM), which employs the diffuse reflectance technique.
The generation of a spectrum is then done by recording the light reflected by the sample. Insight into the chemical bonds present within the sample are shown by peak positions while concentration correlates to peak intensities.
Spectrum Two NIR
Easy and fast measurements of the potency in dried cannabis flower are offered by the PerkinElmer Spectrum Two FT-NIR featuring the Near-Infrared Reflectance Module (NIRM), shown in Figure 2.
The instrument optics generate excellent spectral uniformity across the beam and a high collection efficiency because they are designed to provide tight control of the optical geometry.
Energy throughput is maximized by using gold-coated optics, and excellent performance over the entire NIR spectral range is provided by a high sensitivity Indium Gallium Arsenide (InGaAs) detector.
Combining all of these design optimizations creates a sampling module that can facilitate the easy transferability of methods from one instrument to another – a key requirement for method deployment on multiple instruments.2
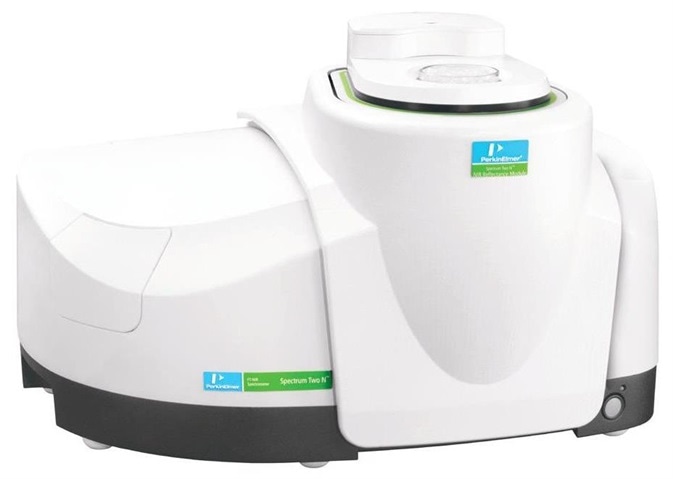
Figure 2. Spectrum Two NIR equipped with a Near Infrared Reflectance Module and sample spinner. Image Credit: PerkinElmer Cannabis & Hemp Testing Solutions
Experimental
First, there was an acquisition of FT-NIR spectra from 302 unique flower samples. The flower samples were then cured at the cultivation site before sample submission to the analytical laboratories (Napro Research, Sacramento, CA; LightScale® Labs, Portland, OR).
An electric or manual grinder was used to homogenize the dried flower, and 1.0 – 1.5 grams of the homogenized flower was placed in a 60 mm glass petri dish; this was then placed atop the NIRM window.
The spinner rotates in a way that causes different parts of the sample to be scanned as the sample spectrum is being measured; this averages out the inhomogeneities. A truly representative measurement is the result of using the larger sampling area.
There was a collection of spectra over the 10,000 – 4,000 cm-1 spectral range at 8 cm-1 resolution, with each spectrum being the result of 64 averaged spectra. Interleaved mode was used to acquire data for a total measurement time of approximately 90 seconds.
This measurement configuration uses an internal mirror that moves to direct the light either to the sample or to an internal standard which allows for the collection of background scans periodically throughout the collection of sample spectra.
The reproducibility of the analysis is increased through the collection of background scans during each sample measurement because it eliminates the potential for errors associated with environmental fluctuations in humidity and temperature.
The flower samples were removed from the petri dish following FT-NIR data acquisition; they were then subjected to HPLC analysis to determine potency. The potency values for CBDA, THCA, CBD and THC were determined using HPLC, and total CBD and total THC were calculated as described in the literature.3
FT-NIR models for total THC and total CBD were then generated using the chromatographic reference data.
Chemometric Model Development
There are small, subtle differences present in different flowers that are significant enough to build quantitative models for potency despite the FT-NIR spectra appearing to be very similar.
Figure 3 shows an example near-infrared spectra of a dried cannabis flower. The measurement of a variety of samples types for calibration is required to build a robust model for cannabis flowers.
All sources of variation normally encountered for cannabis flower should be covered by the calibration set, including flower morphologies, chemical compositions, cultivars and different harvest batches. In order to ensure a stable model, it is critical to capture this variation.
To determine cannabis flower potency, principal component regression (PCR) was chosen. PCR is used to explain the observed variability in the spectral data set by reconstructing the NIR spectra into principal components.
These principal components represent the most significant sources of variation within the data and are linear combinations of the original NIR spectra. Then, a linear regression of the potency values on the principal components is performed to create a calibration curve.
Spectra were randomly split 20:80 into validation and calibration datasets, respectively. Each property value had spectral pre-processing optimized independently, total CBD and total THC.
The data set was randomly segmented into equally sized subgroups (k = 10) in order to perform K-fold cross-validation on the calibration data. For cross-validation, k-1 of the subgroups are used to calculate a model, with the remaining group then used as a prediction data set.
This process is repeated until each group has been left out of the model, generating a series of prediction results from each of the subgroups. Optimization is aided by the cross-validation process by assessing the model’s potential performance when presented with an independent data set.
After generating and optimizing the model, the cross-validated model was independently validated using the remaining 20% of spectra that were randomly selected from the original 20:80 split.
The purpose of the independent validation step is to determine how well the model will predict new data that was not included in the calibration step. Using this process, it is possible to gain an insight into how the model will perform once implemented in the laboratory setting.
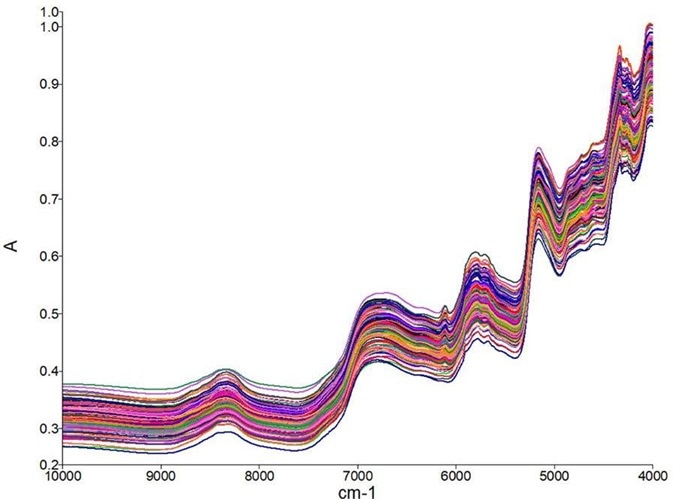
Figure 3. Raw spectra collected from the dried cannabis flower samples. Vertical offsets are due to scattering. Image Credit: PerkinElmer Cannabis & Hemp Testing Solutions
Quantifying the Potency of a Cannabis Flower
Figure 4 shows the results of the calibration curve for total CBD and total THC, and table 1 summarizes regression details. Flower samples ranged between 0 – 20.4% total CBD with a mean of 8.7%, and 0.1 – 23.4% total THC with a mean of 9.9%.
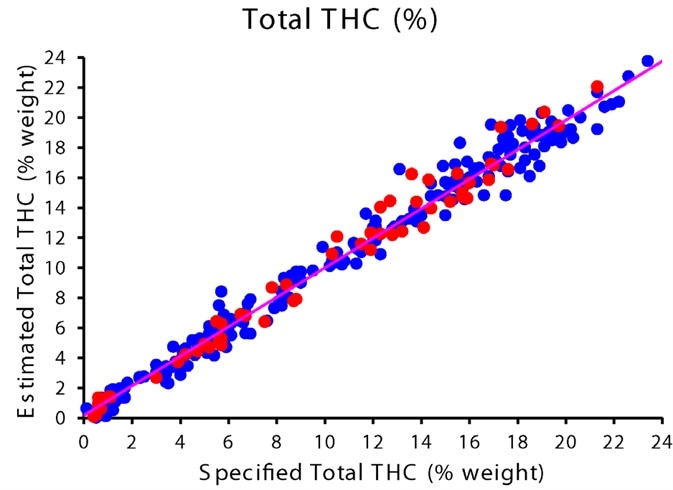
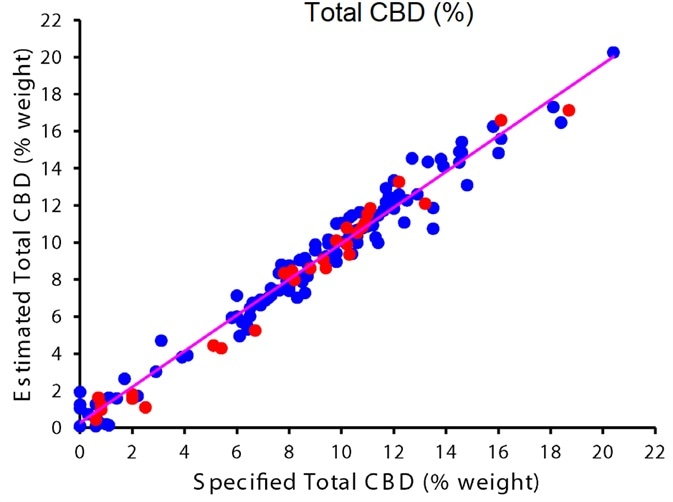
Figure 4. Correlation plots showing calibration (blue) and validation (red) data points for percent Total THC (top) and Total CBD (bottom). Image Credit: PerkinElmer Cannabis & Hemp Testing Solutions
The two calibration curves both show an excellent correlation between the specified and predicted potency values. R2, the coefficient of determination, is 0.98, and the cross-validated standard error of prediction (CV-SEP) for total THC is 0.98%.
A very similar performance is shown by the CBD model with a CV-SEP of 0.94% and a coefficient of determination of 0.97. The CV-SEP can be considered the expected magnitude of error when independent samples are predicted by the model.
The high coefficient of determination working with the low CV-SEP indicates the model’s ability to make precise measurements of potency across the entire calibration range.
Table 2 summarizes the independent validation results. Accurate prediction across the entire calibration range is shown in these results, which indicates that there are not any gaps in the calibration curve.
Starter calibrations can be used with the NIRM and Spectrum Two N to determine the total CBD and total THC in dried cannabis flowers. Starter calibrations greatly reduce method development time as a quantitative chemometric model has already been developed that accounts for the large variation inherent in the cannabis flower.
Implementing these starter calibrations requires on-site method validation for the purpose of ensuring that the selected cannabis flower is representative of those used to generate the calibration model.
Using on-site validation involves measuring a small sample population with reference HPLC potency values. The starter calibration model then incorporates these on-site validation samples, which further increases the modeled sample variation.
Table 1. Summary of the regression details for Total THCA and Total CBDA chemometric models. Source: PerkinElmer Cannabis & Hemp Testing Solutions
Property
Value |
Average |
Range |
R2 |
Number of
PCs |
CV-SEP
(%) |
SEP
(%) |
| Total THC (%) |
9.8 |
0.1 – 23.4 |
0.98 |
9 |
0.98 |
0.92 |
| Total CBD (%) |
8.7 |
0 – 20.4 |
0.97 |
12 |
0.94 |
0.72 |
Table 2. Results from the independent validation procedure. Source: PerkinElmer Cannabis & Hemp Testing Solutions
Property
Value |
R2 |
Average
Reference Value |
Average
Predicted Value |
SEP (%) |
| Total THC (%) |
0.989 |
9.9 |
9.9 |
0.92 |
| Total CBD (%) |
0.988 |
8.1 |
7.9 |
0.73 |
Process Control and Optimization
There is the potential to fundamentally change the understanding of the cannabis growth process through the use of FT-NIR spectroscopy by delivering time-resolved potency data that can be used to trend cannabinoid expression and optimize growth conditions in real-time.
Using the near infrared spectrum of a cannabis flower provides an immediate potency update or unique chemical snapshot that can be used to establish batch trajectories. It is possible to identify abnormal trends before harvest because of the ability to trend batches over time.
Trending data can alternatively be used to manipulate external factors such as light exposure, feeding schedules and temperature by investigating conditions to maximize the cannabinoid expression behavior. This data would provide cultivators with critical insight to future cannabinoid and potency yield as well as early plant growth.
Conclusion
The use of a low-cost, rapid and on-site technique for the accurate measurement of flower potency would benefit the cannabis cultivation industry. FT-NIR spectroscopy provides a wealth of information regarding the cannabis flower’s chemical composition.
When FT-NIR is combined with chemometrics it offers unparalleled simplicity and speed that is unable to be matched by traditional techniques. This article has shown how the PerkinElmer Spectrum Two NIR with the Near-Infrared Reflectance Module (NIRM) can be used to quantify total CBD and total THC in a dried cannabis flower.
Using FT-NIR directly at grow sites would get rid of the associated cost and lag time that comes with submitting samples to third-party laboratories; it would also reduce overall development and research costs for cultivators.
References
- Warner, Marcus L., et al. “Comparative analysis of freshly harvested cannabis plant weight and dried cannabis plant weight.” Forensic Chemistry 3 (2017): 52-67.
- Near-Infrared Reflectance Sampling Accessories for the Frontier and Spectrum Two N FT-NIR Spectrometers, PerkinElmer, Inc.
- Jikomes, Nick, and Michael Zoorob. “The Cannabinoid Content of Legal Cannabis in Washington State Varies Systematically Across Testing Facilities and Popular Consumer Products.” Scientific Reports 8 (2018): 4519. PMC. Web. 16 Aug. 2018.
About PerkinElmer Cannabis & Hemp Testing Solutions
 With the cannabis and hemp markets continuing to grow rapidly and regulations strengthening, labs increasingly need streamlined access to best-in-class testing solutions geared toward the unique requirements of the industry. Whether your lab is well established or just starting up, PerkinElmer is a single-source vendor for instruments, methods, reagents, and consumables on hand to help enhance your testing capacity and get ahead of the competition.
They help drive analytical best practices and operating procedures and commit to ensuring your laboratory has maximum uptime. Learn about their various instruments, testing methods, and applications for cannabis analyses. Let them work with you to build an efficient workflow, so you can focus on growing your business.
Sponsored Content Policy: AZO Life Science publishes articles and related content that may be derived from sources where we have existing commercial relationships, provided such content adds value to the core editorial ethos of AZO Life Science, which is to educate and inform site visitors interested in medical research, science, medical devices, and treatments.