Produced in Partnership with PerkinElmerReviewed by Olivia FrostDec 2 2022
In this interview, Avinash Dalmia, Senior Principal Application Scientist at PerkinElmer, talks to AZoLifeSciences about the analysis of 102 pesticides and 5 mycotoxin residues in hemp regulated by colorado state.
Could you please introduce yourself and tell us about your role at PerkinElmer?
My name is Avinash Dalmia, and I am a Senior Principal Application Scientist at PerkinElmer.
I pioneered the development of the LC-MS/MS method with dual ESI, APCI for the analysis of pesticides in cannabis. My most recent research interest is in the analysis of pesticides, mycotoxins and cannabinoids in cannabis-related matrices.
Image Credit:ShutterStock/Yarygin
Throughout my career, I have presented my research accomplishments in research areas varying from electrochemical sensors, fuel cells, catalysts, thermal and fluid flow modeling, MS ion sources, HPLC/MS and GC/MS applications and have published 15 papers and 20 patents.
Recently, I was also a recipient of the 2021 ElSohly Award for my contributions to cannabis analysis and research.
How does your work with PerkinElmer correspond with the state regulation of pesticides and the hemp matrix?
Firstly, it is necessary to address the specific pesticide action limits in US and Canada for hemp and cannabis matrix. This involves data analysis of non-polar pesticides using novel LC/MS/MS methods with ESI and APCI sources.
As a company, we would like to empower labs to understand how to mitigate hemp matrix effects to improve their method sensitivity to meet low detection limits in hemp and cannabis matrix. Canada and different US states regulate varying numbers of pesticides and hemp matrices. There are regulations for 59 pesticides in Oregon, 66 in California, 96 in Canada and 102 in Colorado for hemp.
The action limits for the same pesticides are much lower in Colorado and Canada in comparison to other US states such as Oregon and California. For example, the action limits for acequinocyl, one of the pesticides, is 2 PPM in Oregon, 0.1 PPM in California, and 0.03 PPM in Canada and Colorado State.
As the action limits become more stringent and the number of regulated pesticides increases in the hemp matrix, we need to ensure our method continuously improves to help in the analysis of a larger panel of pesticides with better detection limits in the hemp matrix.
How is pesticide analysis performed?
It is well known that pesticide analysis is normally carried out using both LC/MS/MS and GC/MS/MS instruments as an electrospray ion source in LC/MS/MS systems cannot ionize non-polar pesticides such as quintozene - but APCI ion sources can.
Therefore, to develop a method for the analysis of 102 pesticides and five mycotoxins with different polarities, we tend to utilize an LC/MS/MS with the dual ESI and APCI ion with different inlets.
In a single source LC/MS/MS system, it takes a long time to exchange ESI with an APCI ion source and vice versa. In our system, with the dual ion source with different inlets, we can easily switch from one ion source to another just by diverting a valve to analyze both polar and non-polar compounds.

Image Credit:ShutterStock/Tsareva.pro
By using our unique LC/MS/MS system with ESI and APCI ion source, we can analyze these compounds with good detection limits to meet Colorado State action limits in the hemp matrix.
For example, cyhalothrin is a non-polar pesticide, which is normally analyzed by GC/MS/MS because it is very difficult to ionize the electrospray ion source, but we know that it can be ionized as ammonia adduct due to its low proton affinity.
Resultingly, we had to perform a considerable amount of method optimization in order to get a lower LOQ of about 0.05 PPM for this compound, which can easily meet action limits of 0.25 PPM in hemp.
What specific features of PerkinElmer’s LC/MS/MS system sets it apart from others in the industry?
An example compound needs to be used to help answer this question: Methoprene is an oxygenate hydrocarbon with a low proton affinity. If you look at the structure of this compound, normally, people would think that it can only be analyzed using GC/MS/MS, but since our system has a heated electrospray ion source, we can ionize this compound with a good ionization efficiency and good detection limits.
Our novel LC/MS/MS method with an APCI ion source is great for the analysis of non-polar pesticides such as etridiazole and quintozene. If you look at the structure of this compound, you will notice that it is highly non-polar and halogenated, and thus most people assume that it can only be analyzed using GC/MS/MS with an AI source. But that is not true, we can measure these analytes with good deficient limits using an APCI ion source.

Image Credit:ShutterStock/Fotokostic
Etridiazole is another non-polar pesticide with very low proton affinity, so it cannot be ionized in positive ion mode with good efficiency using both an electrospray and APCI ion source.
However, we have demonstrated the ability to measure this compound with good sensitivity in hemp at a very low level of 0.01 PPM using an APCI ion source’s negative ion mode by ionizing this compound with dissociative electron capture ionization mechanisms.
Could you please describe how the ESI and APCI ion sources are used to meet Colorado State requirements?
As I have mentioned, our system ionizes different non-polar compounds using ESI and APCI ion sources. Quintozene is the only compound that requires the APCI ion source to get a good signal. We tried and failed to get a signal for this compound using electrospray ion source (ESI).
Nonetheless, for the other 101 pesticides and five mycotoxins, we can ionize these compounds with both ESI and APCI ion sources, but based on the signal we get for a particular compound with a given ion source, we choose a certain ion source to measure these compounds at lower action limits.
If the compound has a better signal with an ESI ion source, that compound is measured with an ESI ion source. If a compound has a better signal with an APCI ion source, then it is measured with an APCI ion source.
Therefore, quintozene is the only compound among these different compounds where we can only measure this compound with APCI ion source. Although we are still managing to achieve good detection limits for this compound, our LOQ is 0.005 PPM. Not only is our method sensitive, but it is selective for quintozene analysis.
What challenges are faced when performing ionization of various compounds?
To answer this, it is worth discussing the ionization mechanism of some of these non-polar pesticides with APCI ion sources in negative ion mode. It is well known that the most common ionization mechanism is the deprotonated molecular ions produced by proton abstraction for pesticides such as fipronil with acidic functional groups.
For other pesticides, we have not observed deprotonated molecular ions, so we have had to determine other unique ways of ionizing these compounds to get a good signal and good detection limits.
For example, other non-polar pesticides, such as chlordane, form adduct ions in negative mode via anion attachment. Acequinocyl gets ionized by electron capture with an APCI ion source in negative ion mode. Odd electron ions are normally observed with GC/MS/MS with an EI source. This ionization mechanism of acequinocyl is unique because it results in the formation of an odd electron-ion.

Image Credit:ShutterStock/David Moreno Hernadez
Pesticides such as etridiazole, chlorfenapyr, iprodione, bensulide and others are ionized by dissociative electron capture. Among these different non-polar compounds, the ionization mechanism of quintozene is the most interesting and unique.
In our proposed mechanism of ionization of this molecule, the oxygen molecule captures electrons formed in the corona discharge region of the APCI ion source to form a superoxide reagent ion. This superoxide reagent ion reacts with quintozene to ionize it by losing chlorine and adding an oxygen atom.
Hemp is one of the most difficult matrices for pesticide analysis since it causes matrix interference and matrix effects such as ion suppression or enhancement. It is a complex plant comprising at least 500 different compounds, including more than 113 phytocannabinoids and 120 terpenes.
Some of these constituents, like cannabinoids and terpenes, are present in plants at percentage level and PPM range, respectively.
So these terpenes or cannabinoids can get co-extracted with trace level or PPB level of pesticides and cause matrix interference and matrix effects if they have the same retention time as the pesticide or a mycotoxin you’re trying to measure in hemp matrix.
What are some of the strategies that you have deployed to reduce matrix effects to improve the overall sensitivity of your method?
Our first strategy was to optimize the MS method to reduce matrix interference to get better sensitivity.
When we use MRM transitions for propiconazole, based on monoisotopic mass, it shows a lot of matrix interference, and our method LOQ is very high at approximately 0.2 PPM. The propiconazole transition based on monoisotopic mass has the best signal in solvent standard, but LOQ with this transition is high due to the matrix interference from hemp matrix.
On the other hand, when we used MRM transitions based on M plus two isotopes of this molecule, the matrix interference was minimized. In this case, the LOQ was approximately ten times lower, which is about 0.02 PPM.
As this pesticide had two chlorine atoms, when we used MRM transitions based on M plus two isotopes, we lost approximately 30% of the signal. However, we were able to reduce the matrix interference roughly by a factor of 10 to improve overall method sensitivity by a factor of 10.
In another example for iprodione, which is a non-polar pesticide, we were also able to reduce the matrix interference by switching from ESI to APCI ion source.
If the ionization mechanism is the same for a compound with both an ESI and APCI ion source, the ESI source will give a better signal in comparison to the APCI ion source.
Take fenvalerate as an example, we were able to improve our signal with an APCI ion source in comparison to the ESI ion source by determining a new ionization mechanism for this compound. Thus, we are forming only ammonia adducts when we analyzed this compound using ESI ion source.
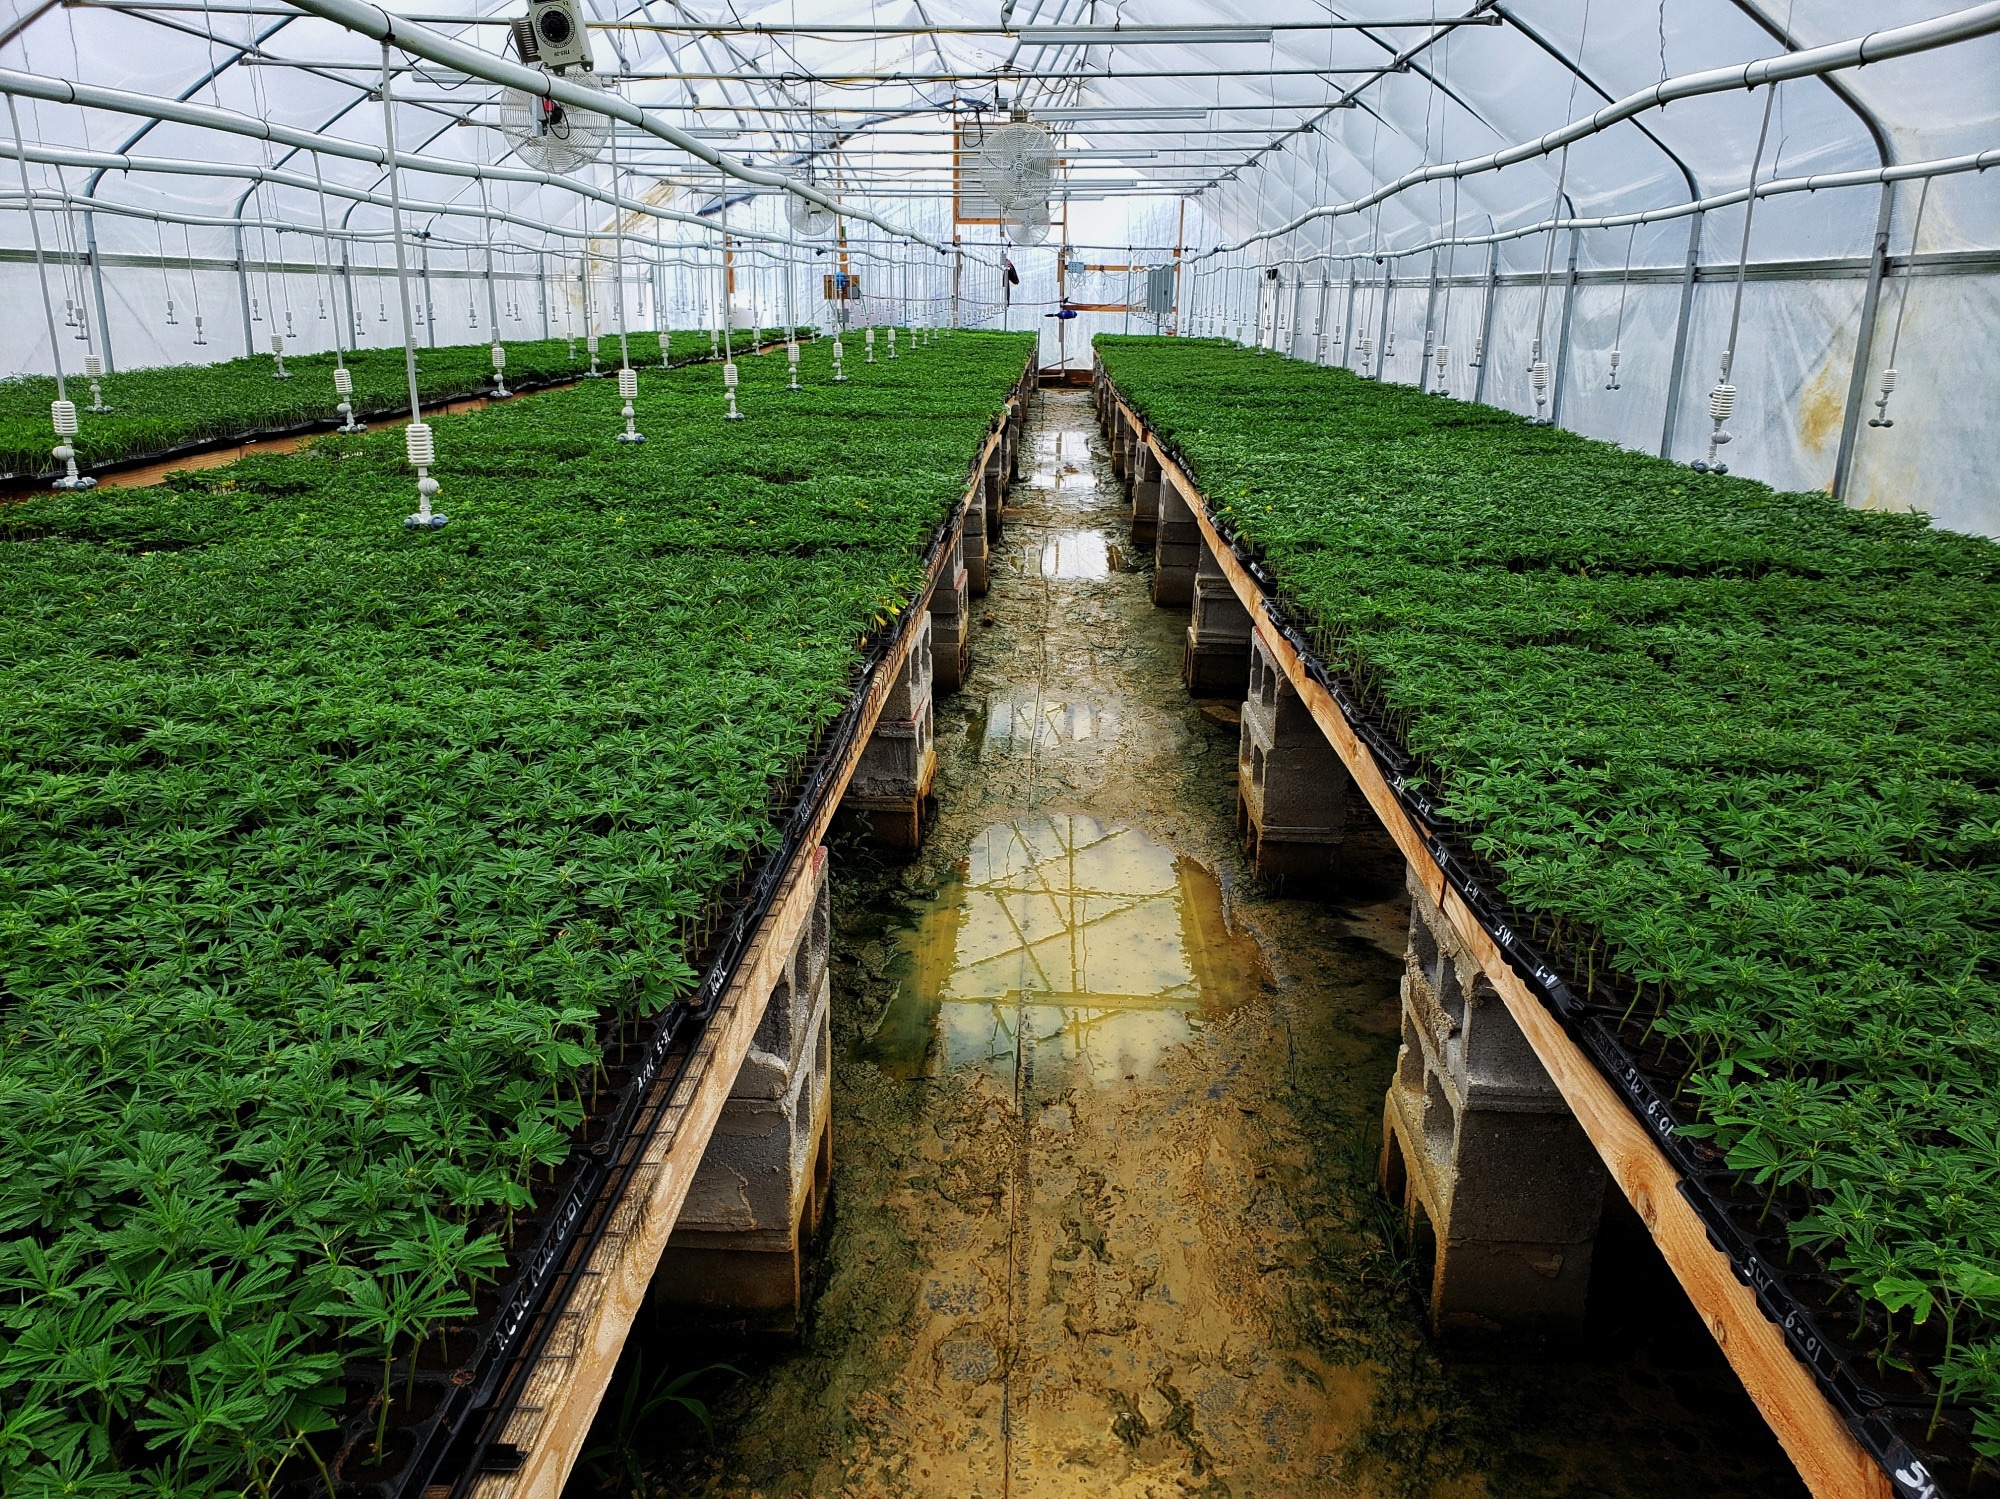
Image Credit: ShutterStock/Seth Michael
Since this compound has low proton affinity, we barely meet the action limit for this compound in hemp. Our method only just meets the Colorado State action limit of 0.2 PPM because our method LOQ is 0.2 PPM with the ESI ion source.
But when we started analyzing this compound with APCI ion source, we were able to improve the signal by more than a factor of 10 because we are ionizing this compound using a different ionization mechanism, which is dissociative electron capture.
So just by changing the ionization mechanism and the ion source, we were able to improve the detection limits by a factor of 10 for fenvalerate in this case - and now, our APCI ion source can easily meet the action limit of 0.2 PPM for fenvalerate in hemp.
When analyzing acequinocyl, earlier, I mentioned using an electrospray ion source in positive ion mode with a LOQ of 0.01 PPM. Yet, recently, we started analyzing this compound using an APCI ion source in negative ion mode, which produced excellent detection limits of 0.005 PPM.
So now, our customers can measure this difficult compound with two different ion sources to increase their confidence in measuring this challenging compound.
Overall, I think the APCI ion source method is slightly more sensitive and selective, with fewer matrix effects for acequinocyl compared to the ESI ion source method.
Aside from improving detection limits by optimizing our MS method or by changing the ion source, are there any other methods to achieve this?
For another non-polar pesticide, endosulfan-beta, which we analyzed with an APCI ion source, we were able to improve detection limits by optimizing our MS method or by changing the ion source. However, we were also able to improve detection limits by simply optimizing our LC method.
When we used a fast six-minute LC gradient with an APCI ion source, we were able to observe a 75% ion suppression for endosulfan-beta – and with this much ion suppression, our method LOQ of 0.1 PPM was unable to meet Colorado State action limits of 0.05 PPM. So we knew that we had to either change our MS method or LC method to improve detection limits.
We were not able to improve detection limits by just changing the MS methods. So, in this case, what we did was we used optimum and longer 11-minute LC gradients. When we did that, the ion suppression effects were minimal, and baseline noise was reduced by a factor of two.
As a result, the method LOQ was improved by a factor of 10, the signal improved by a factor of five and the noise was reduced by a factor of two. With these results, we can easily meet action limits for this compound because our method LOQ is 0.1 PPM, and the actual limits are 0.5 PPM.
In order to understand this further, we collected negative mode scan data with an APCI ion source for the hemp matrix to determine CBDA, the main cannabinoid in hemp. The hemp sample used for our data collection had about 6.5% CBDA.
We see a higher ion suppression effect than endosulfan-beta with hemp because we used a fast six-minute LC gradient because both CBDA and endosulfan-beta have a similar retention time of about 3.29 minutes using this LC method.
But when we slow down the LC gradient to 11 minutes, we get baseline suppression between CBDA and endosulfan-beta and now the ion suppression effects are almost negligible for the specified hemp matrix. The retention time for endosulfan-beta was 3.93 minutes, and CBDA was 4.03 minutes, using the optimum 11-minute LC gradient.
We are also measuring five mycotoxins and the 102 pesticides in the hemp matrix. One of the mycotoxins that we are analyzing is ochratoxin A. And the action limit of ochratoxin A in hemp is 20 PPB in different US states and Canada, except for Colorado State, where the action limit for this compound is 5 PPB in hemp.
For this, I had to carry out a lot of LC and MS method development to improve the signal for ochratoxin by a factor of five. Our method LOQ at the end of development was 4 PPB. I would like to point out here that we are measuring all the pesticides and mycotoxins using ESI and APCI ion sources, as there is no separate LC/MS/MS method for mycotoxins.
What is the process for sample preparation?
Sample preparation depends on a number of factors and what suits the application best. However, the ideal option is one that is simple, fast, cheap, green, and can be automated with good extraction efficiency. For that reason, we chose simple solvent extraction as our sample preparation method.
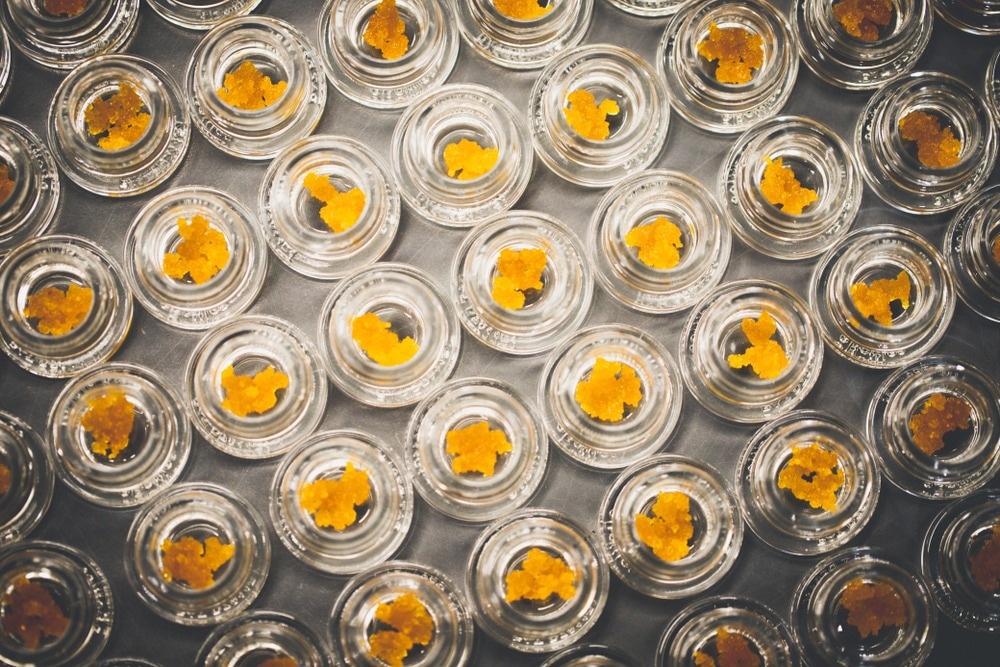
Image Credit:ShutterStock/Tsareva.pro
Solvent extraction is the most suitable method to achieve high throughput in a cannabis production lab because it is simpler, faster, and cheaper as it has less number of steps. It is greener because it does not require any solvents, which are needed in other sample preparation methods, and it can be automated easily because it has fewer steps.
How do you evaluate which sample preparation is best, is it solely based on being faster, simpler, cheaper, greener, and automatable?
When it comes to evaluating a sample preparation method, it is very important to determine its extraction efficiency. Extraction efficiency can be determined by taking the ratio of the signal in pre-spiked and post-spiked extract and timing it by 100. For example, we are aiming to achieve optimal extraction efficiency for all 102 pesticides and five mycotoxins in hemp in the range of 80 to 120%
For comparison, the extraction efficiency for pyridaben with QuEChERS followed by dSPE cleanup and solvent extraction followed by SPE and dSPE cleanup method is only 68% and 58%, respectively.
If you utilize solvent extraction with evaporation, then your extraction efficiency is almost 0%. Only our simple solvent extraction method gives you an extraction efficiency of 95% for pyridaben, which is close to a 100%.
So if you utilize these other three sample preparation methods, you will lose anywhere from 32 to 100% of pyridaben during your sample preparation method. That means that your method accuracy and detection limits will be compromised by anywhere from 32 to 100% when using these complicated, expensive, time-consuming sample preparation methods.
Have you developed any internal standards to monitor matrix effects and ensure compliance with Colorado State regulations?
After good extraction efficiency of the sample preparation method is achieved, the next step would be to determine the matrix effects that are observed on the extract that was obtained with the chosen sample preparation method.
To calculate the matrix effect, you need to take the difference between the signal for the analyte in the post-spiked hemp extract and the solvent standard. You then divide this difference by the signal for your analyte in solvent standard and multiply this by 100 to get your matrix effect in the percentage range.

Image Credit:ShutterStock/Oasishifi
If analytes show a matrix effect that is greater than 20%, this means that the analyte is experiencing a significant signal enhancement effect. If your analytes are showing matrix effect, which is lower than negative 20%, your analyte is experiencing significant signal suppression effects.
For most analytes, we see mainly signal suppression effects when an electrospray ion source is used and signal enhancement effects when an APCI ion source is used. As hemp matrices are hydrophobic, most are observed at a higher retention time with the reversed-based LC columns.
Hemp, cannabis products are available in different forms such as plants, concentrates, and edible products, such as gummy bears, chocolates and beverages. The matrix effects are different in different strains of cannabis hemp plant distillate and edible products such as gummy bears, chocolate and beverages. These matrix effects are different because different strains of hemp plant distillate and edible products have different amounts of cannabinoids, terpenes, fats and sugar content.
Therefore, it is difficult to determine a universal matrix, which can represent these different cannabis hemp matrixes for accurate matrix match calibration. Therefore, matrix match calibration is not suitable for the quantitation of pesticides and mycotoxins in different cannabis matrices since it is complex and time-consuming.
Another option is to use solvent-based calibrants for the quantitation of pesticides and mycotoxins in different cannabis hemp matrices.
When using solvent standard-based calibrants, you need to account for matrix effects to achieve higher method accuracy by adding internal standards. At PerkinElmer, we developed a solution containing 30 internal standards, which is part of the PerkinElmer reagent kit for our customers, to improve method accuracy by compensating for matrix effects.
This kit also contains reference standards for 75 pesticides, five mycotoxins, and consumable items for preparing 500 samples. So you do not need to spend time procuring and preparing them.
Are there any other features that you have developed at PerkinElmer that you would like to summarize for our readers?
We have developed the QS-Works 420 Workflow to automate the testing of pesticides and mycotoxin in cannabis and hemp products with complete traceability and cloud connectivity. With cloud connectivity, you have access to data from anywhere 24 hours a without incurring the high cost of buying and maintaining local servers.
Image Credit:ShutterStock/Dionisvera
We have automated the sample preparation method with Janus Workstation to improve throughput and reproducibility with no manner of intervention. In our workflow, batches are created, and results are processed automatically with a few clicks. The custom reports are created to meet different US state and Canadian regulations in cannabis and hemp products.
In just a few words, please can you summarize the analysis work that you carried out?
In summary, we developed a novel LC/MS/MS method with APCI and ESI ion sources, which can analyze all of the 102 pesticides and five mycotoxins regulated by Colorado State in the hemp matrix. We elucidated the ionization mechanism of different non-polar pesticides with an APCI ion source.
Matrix interference and matrix effects were minimized by MS and LC method optimization and by changing the mode of ionization from ESI to APCI ion source for a number of compounds to improve our method sensitivity.
We believe that solvent extraction is the most cost-effective sample preparation method, which can be automated to achieve high throughput and reproducibility with excellent extraction efficiency.
We added a number of internal standards to our method to compensate for hemp matrix effects, such as signal suppression and enhancement, to get overall method accuracy of 70 to 120% for all 102 pesticides and five mycotoxins with solvent calibration.
About PerkinElmer Cannabis & Hemp Testing Solutions
 With the cannabis and hemp markets continuing to grow rapidly and regulations strengthening, labs increasingly need streamlined access to best-in-class testing solutions geared toward the unique requirements of the industry. Whether your lab is well established or just starting up, PerkinElmer is a single-source vendor for instruments, methods, reagents, and consumables on hand to help enhance your testing capacity and get ahead of the competition.
They help drive analytical best practices and operating procedures and commit to ensuring your laboratory has maximum uptime. Learn about their various instruments, testing methods, and applications for cannabis analyses. Let them work with you to build an efficient workflow, so you can focus on growing your business.
 Overcoming challenges associated with analyzing pesticides