When light interacts with biological tissues, useful information can be obtained about the nature and the state of diseases affecting them. There is growing interest in the application of spectroscopy as an alternative for detecting, diagnosing, and monitoring diseases.
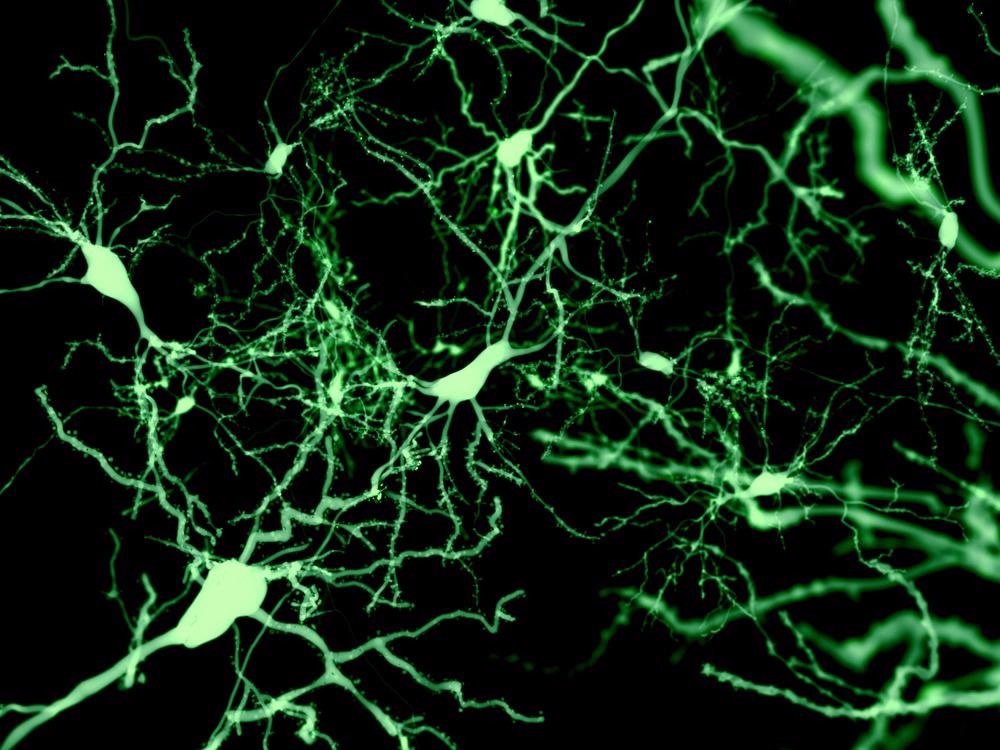
Image Credit: Juan Gaertner/Shutterstock.com
The analysis of light interactions with tissues provides insight into their metabolic and pathological state. This use of spectroscopy can enable diagnosis without using invasive methods such as biopsies.
There are several ways to deliver incident light, including using optical fibers placed within minimally invasive clinical tools, such as endoscopes, to reach tissues in a highly localized manner. Spectroscopic techniques can be less risky, less expensive, and faster than other methods.
Magnetic Resonance Spectroscopy to Monitor the Progress of Neural Diseases
Generally, the investigation of brain diseases recurs to techniques such as Computer Tomography (CT), Positron Emission Tomography (PET), and Magnetic Resonance Imaging (MRI). However, over the last few years, Magnetic Resonance Spectroscopy (MRS) has emerged as a powerful technique for studying neural diseases.
MRS does not involve radioactivity or ionizing radiations. In contrast to MRI – which gives anatomic images of the structures under examination – MRS provides information on a molecular level, displaying the chemical profile of the brain regions analyzed.
With a method called Chemical Shift Imaging (CSI), multiple localized spectra are acquired from a single slice (two-dimensional CSI) or across the entire brain (three-dimensional CSI). Several chemicals can be identified and quantified depending on the nuclei that MRS can detect during the analysis (i.e., 1H, 13C, 15N, 31P, etc.). Metabolism alterations can therefore be investigated with MRS.
Since changes in the level of certain neurotransmitters – N-acetyl-aspartate (NAA), myo-inositol (mIns), and creatine (Cre) – are associated with neural diseases such as Parkinson's and Alzheimer's disease, MRS can play a crucial role in the diagnosis and monitoring of disease progression and treatment, as well as add critical value for earlier diagnosis and more efficient treatment.
Fluorescence Spectroscopy for Tracking Metabolites Associated with Diseases
All biological tissues exhibit endogenous fluorescence when irradiated with light of an appropriate wavelength (autofluorescence). This is due to the presence of many endogenous fluorophores, such as tryptophan, porphyrins, and flavins, to name a few, with specific and characteristic excitation and emission spectra.
Fluorescence spectroscopy can provide information on the state of cell metabolism. As diseases progress, disruption in the metabolic pathways of diseased cells causes changes in the concentration of metabolites. For instance, cancerous cells have enhanced metabolic activity as tumors develop, resulting in increased production of NADPH (the reduced form of nicotinamide adenine dinucleotide phosphate) and metabolites such as lactate.
Changes in the concentration of the molecules mentioned above can potentially be characterized with fluorescence spectroscopy. Unfortunately, excitation and emission spectra of multiple fluorophores often overlap, causing undesirable background fluorescence signals.
Therefore, correction strategies or alternative solutions have been proposed. One of the leading solutions to overcome the problem of background fluorescence is the use of externally administered (exogenous) fluorophores with a particularly intense fluorescence emission that can be measured above the background.
In addition, another solution is to use wavelength and band-pass filters to remove background fluorescence. A probe with optical fibers is placed in close contact with the tissue for a sufficient time, allowing for the emitted fluorescence light to reach the detector that filters out the background fluorescence.
Fluorescence spectroscopy has been applied to the real-time assessment of histology of colorectal polyps. This approach could enable a reduction in the risks to patients and reduced medical time and costs associated with polyp resection.
Raman Spectroscopy for the Identification of Disease-Related Abnormalities
Over the last few decades, several studies have demonstrated the potential of Raman Spectroscopy (RS) as a sensitive and non-destructive diagnostic technique for biomedical applications, particularly in the discrimination of abnormal tissues.
Most biomolecules are Raman active and exhibit distinctive signals related to changes in the concentration, mutation, and production of compounds associated with disease progression – namely nucleic acids, proteins, lipids, and carbohydrates.
Chemical bonds in the backbones of these molecules have various vibrational modes, with characteristic signals generally observed in the "fingerprint region" (600-1800 cm−1) and in the region between 2500 cm−1 and 3400 cm−1.
RS's clinical applications involve the upper and lower gastrointestinal tracts (mouth, esophagus, and stomach). Moreover, several studies have demonstrated the use of RS in diagnosing abnormalities in the coronary artery, brain, bowel, and cervix.
Nevertheless, RS is an inherently weak technique and fails to be effective when low analyte concentrations need to be detected. In contrast, Surface Enhanced Raman Spectroscopy (SERS) has emerged as a preferred technique when high sensitivity and specificity are needed.
SERS allows for monitoring neurotransmitters like dopamine and other biological molecules associated with neurological diseases (i.e., Parkinson's disease) thanks to its ability to detect nanomolar concentrations.
SERS could also be applied to monitoring diabetes in real-time. Preliminary in vitro tests show that it is possible to detect glucose in urine and saliva samples directly. In addition, SERS can also detect hydrogen peroxide – a product of glucose oxidation and an indirect indicator of glucose concentration – up to 25 mM.
There is significant interest in the implementation of cancer diagnosis via SERS. Since cancer cells show altered glycosylation states, glycan structures are potential biomarkers for cancer diagnosis. Increased sialic acid levels (associated with several cancers) have been detected by SERS analysis.
Prostate-specific antigen (PSA) is a common biomarker for diagnosing prostate cancer. A SERS-based immunoassay for PSA using gold nanoparticles showed a limit of detection (LOD) of 0.11 pg/mL, which is well below the average PSA level's 4 pg/mL threshold value. This great sensitivity makes SERS an excellent technique for in vivo and in vitro diagnostic applications.
Spectroscopy applied to disease diagnosis has several advantages. As methods and instrumentation advance, with increasing accuracy, selectivity, and lower LODs, spectroscopy techniques will consolidate their potential and, in the future, will play an indispensable role in diagnostic applications.
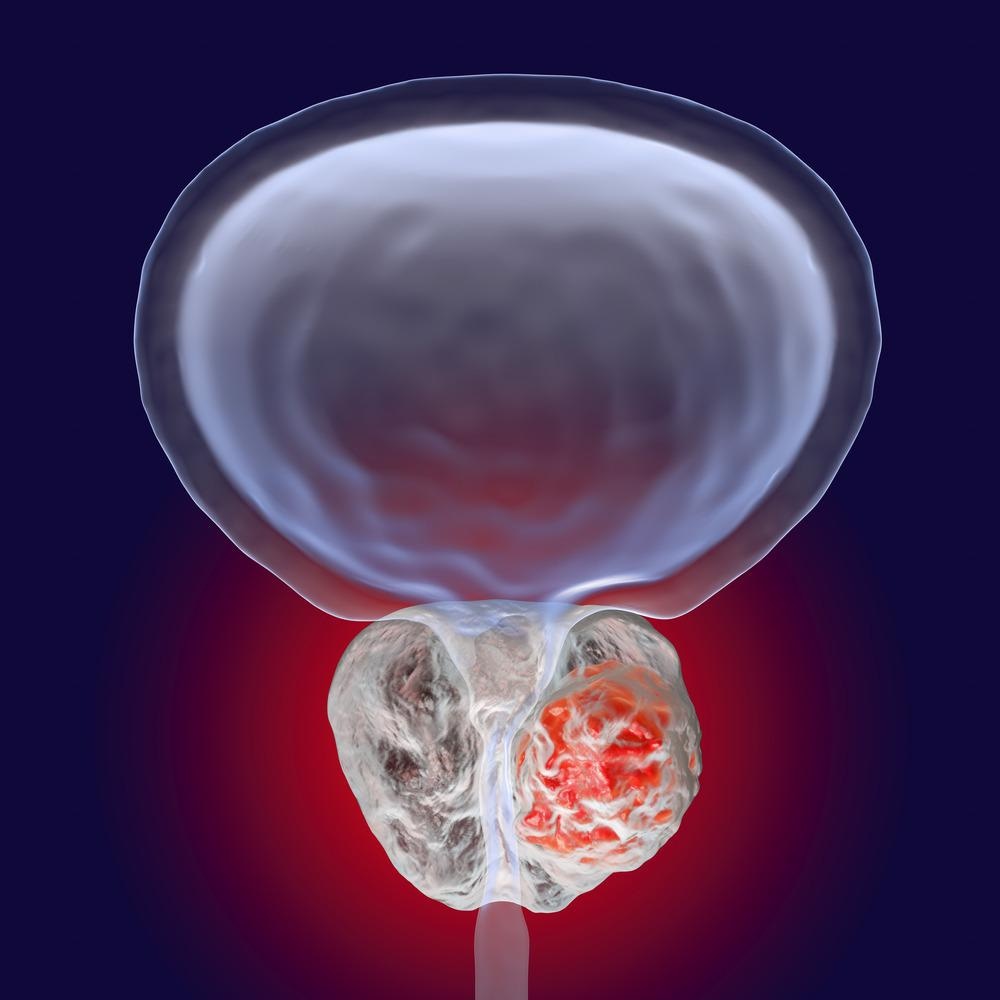
Image Credit: Kateryna Kon/Shutterstock.com
Sources:
- Tran, T., Ross, B. & Lin, A. (2009). Magnetic resonance spectroscopy in neurological diagnosis. Neurol Clin, 27, 21-60, xiii.10.1016/j.ncl.2008.09.007
- Kim, J. A., Wales, D. J. & Yang, G.-Z. (2020). Optical spectroscopy for in vivo medical diagnosis—a review of the state of the art and future perspectives. Progress in Biomedical Engineering, 2, 042001.10.1088/2516-1091/abaaa3
- Paraskevaidi, M., Matthew, B. J., Holly, B. J., Hugh, B. J., Thulya, C. P. V., Loren, C., Stjohn, C., Peter, G., Callum, G., Sergei, K. G., Kamila, K., Maria, K., Kássio, L. M. G., Pierre, M.-H. L., Evangelos, P., Savithri, P., John, A. A., Alexandra, S., Marfran, S., Josep, S.-S., Gunjan, T., Michael, W. & Bayden, W. (2021). Clinical applications of infrared and Raman spectroscopy in the fields of cancer and infectious diseases. Applied Spectroscopy Reviews, 56, 804-868.10.1080/05704928.2021.1946076
- Moore, T. J., Moody, A. S., Payne, T. D., Sarabia, G. M., Daniel, A. R. & Sharma, B. (2018). In Vitro and In Vivo SERS Biosensing for Disease Diagnosis. Biosensors (Basel), 8.10.3390/bios8020046
Further Reading
Last Updated: May 17, 2022