X-ray Fluorescence Spectroscopy (XFS) is a derivative of spectroscopy that resides in the higher end of the electromagnetic spectrum, between ultraviolet and gamma waves.
Paralleling other forms of spectroscopy, such as atomic emission spectroscopy, or electron spin resonance (ESR) spectrometry, uses the refraction of light to uncover the elemental composition of a specified analyte. This is all accomplished using X-ray fluorescence. This methodology is most often attributed to metal alloys, polymers, and is currently being implemented to observe the composition of celestial objects and extraterrestrial matter.
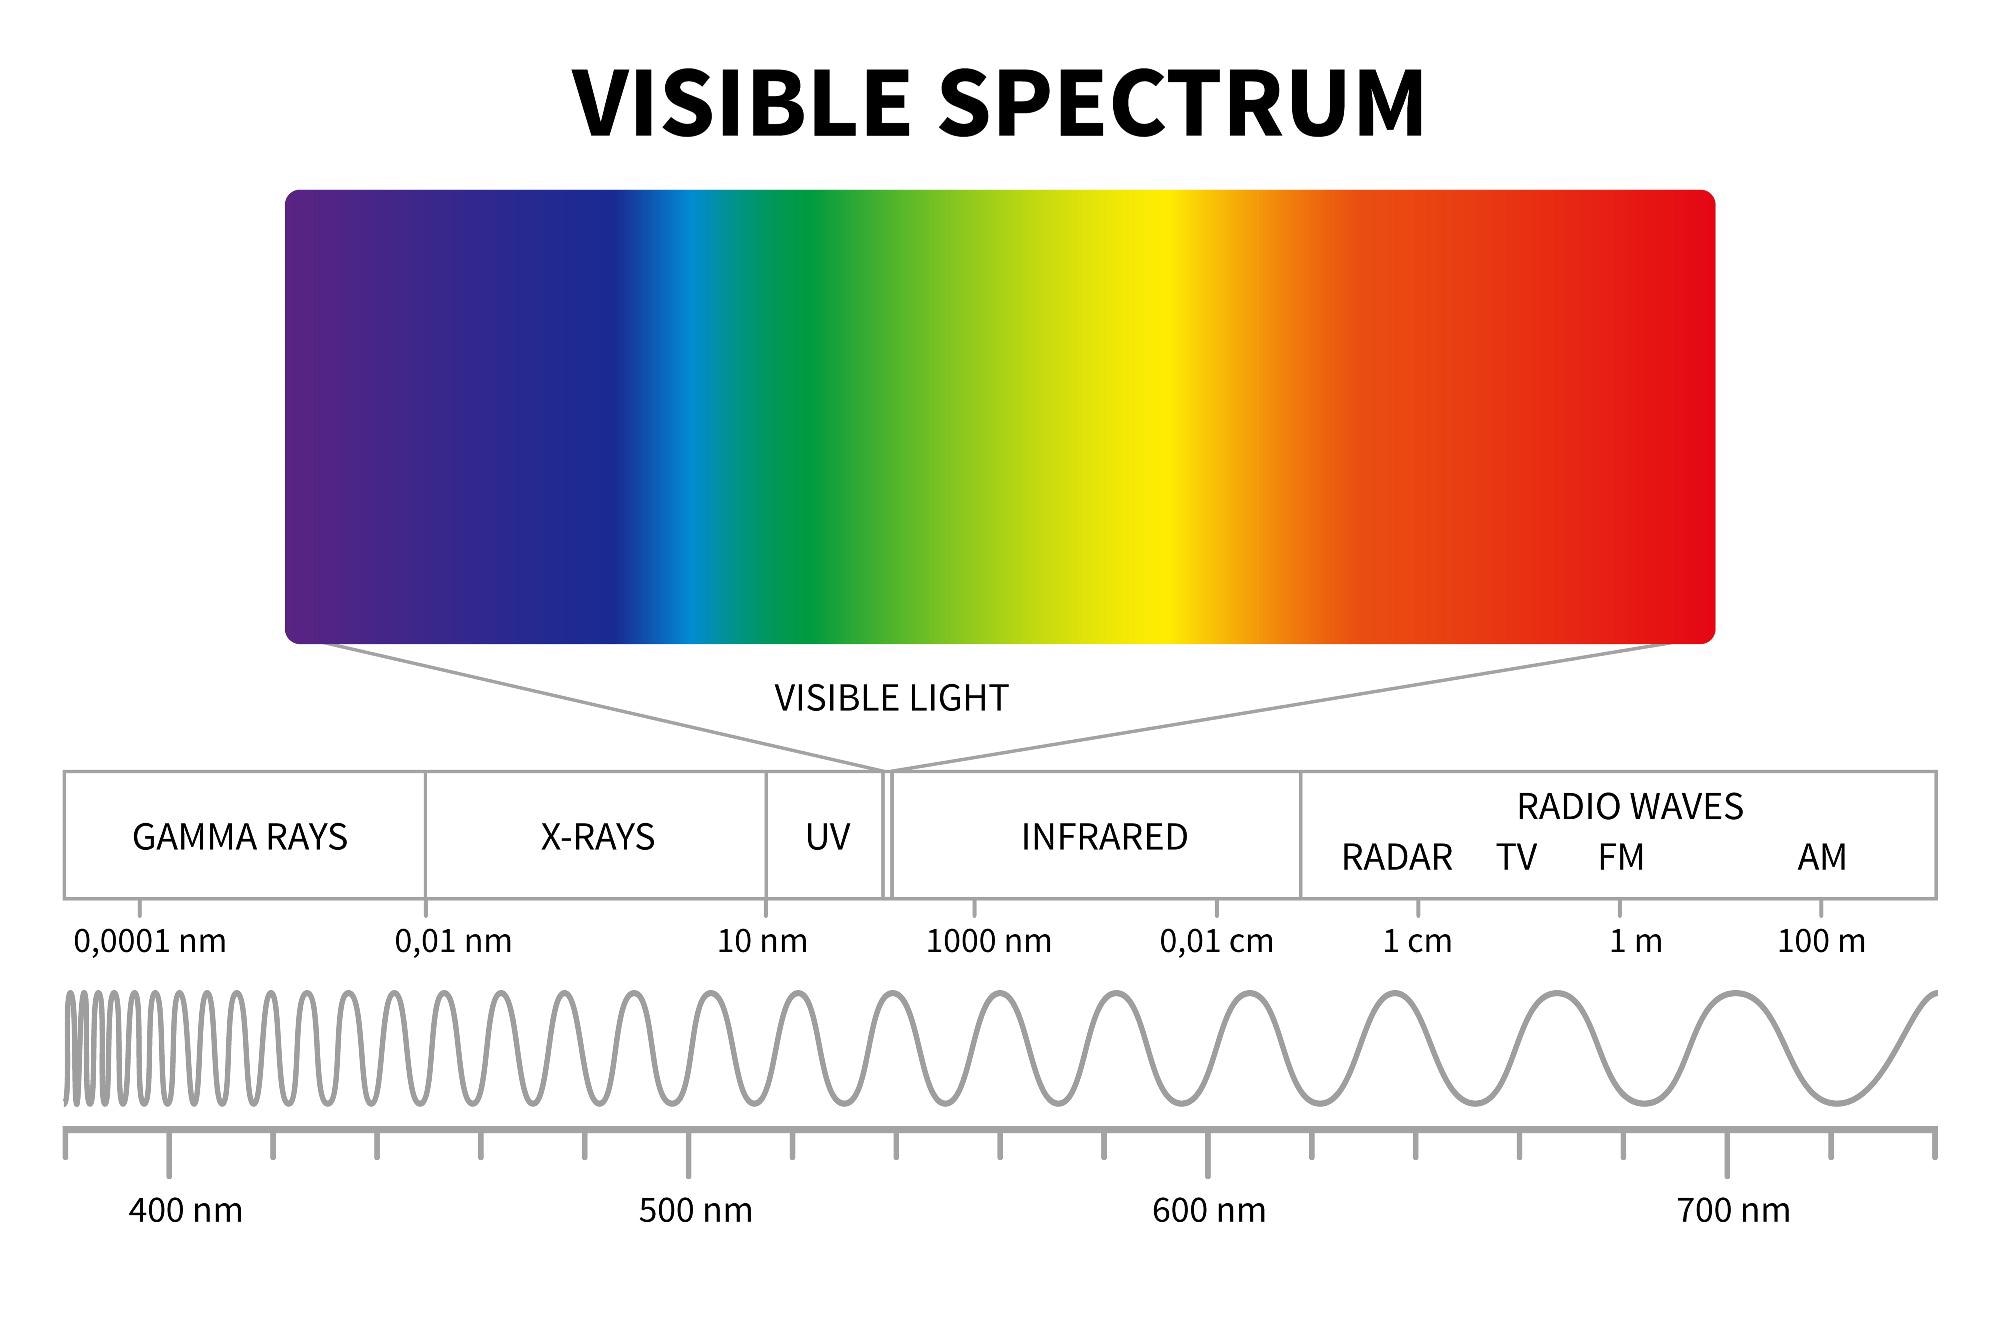
Image Credit: MicroOne/Shutterstock.com
How X-Ray Fluorescence Spectroscopy works
X-ray fluorescence spectroscopy, in its most simplified form, requires an X-ray source, a sample to analyze, and a detector to capture the resulting waveforms. The X-rays irradiate the sample, which will alter the charge and electron orbitals. The X-ray itself will pass through a filter, and using enough radiation, the inner shell electrons of sample atoms will be propelled out. This leads to a subsequent relaxation process, resulting in secondary X-rays that will pass to the detector. In this process, valance electrons will descend to the innermost shell, releasing energy in the form of electromagnetic radiation.
The energy emitted as a result of this vibrational relaxation is characteristic, with different atoms emitting varying degrees of energy. This specific energy is dependent on the difference between the highest occupied molecular orbital (HOMO), and the lowest occupied molecular orbital (LOMO). Each atom has a different energy gap between the two, and as a result, the emitted energy from relaxation carries information about the identity of the atom. This can be expressed empirically using the following formula:
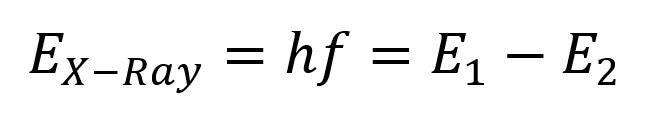
where “h” is Planck’s constant, and “f” is frequency.
Differing Apparatus Set-Ups, and Alterations in the Path of Light
When measuring the intensity of emitted X-ray radiation, there are two ways in which the spectrometer can be assembled:

Depiction of (ED-XRF) & (XD-XRF) hull set up-Image Credit: Amalia Medeiros
One is energy dispersive analysis (ED-XRF). This setup is much more basic, and its key components are simply the detector, the X-ray source, and the sample. This modus is low cost, and the resolution may be compromised on account of the instrumentation’s simplicity. This method also results in poor sensitivity when analyzing low atomic number elements, given that the difference in the HOMO-LOMO gap is smaller and harder to detect than that of elements with higher atomic mass units (AM’s). However, accuracy may be better when assaying samples of low concentration.
The more sophisticated and costly setup takes the form of wavelength-dispersive analysis (XD-XRF), where the emitted energy from the sample comes into contact with an analyzing crystal, rather than simply migrating to the detector. Within the crystal, X-rays are scattered through the crystal lattice. The crystal can then select which wavelengths of radiation enter the detector, filtering the target light via their optical path. This process is founded upon Bragg’s law:
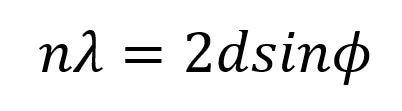
By adjusting both the crystal and the detector to different angles, detection of a wide spectral range is made possible, allowing the user to detect which characteristic wavelengths are bound off the sample. This setup will yield narrower peaks, reduced overlap, higher resolution, and greater sensitivity to lower atomic elements.
Applications of XRF
In addition to the gathering of compositional data, XFS can also measure film thickness, it can map the elements of larger substrates, and can assay trace amounts of uncommon elements. These applications make it very useful in analyzing crime scenes and elucidating the composition of petroleum products. It is used to assay samples in phases of solids, liquid, and powders, acquiring measurements in parts per million (ppm).
Unlike other forms of spectroscopy, such as Pyrolysis-gas chromatography-mass spectrometry (Pyrolysis-GC-MS), or atomic absorption spectroscopy (AAS), it is non-destructive, requiring little sample preparation at a very low cost. These boons are what make this device appealing, a good reason as to why we see an increased demand for them in the current market.
How the Digital Signal Will Appear
Once the data has been processed by the system, a spectrum will appear, one that measures intensity over energy. We see the characteristic wavelengths of the sample displayed in these peaks, each one corresponding to a different element. The greater one peak is, the higher the intensity, equating to a larger amount of that element in a given sample. Depending on the sample’s makeup, and size, this process can be accomplished anywhere between 2 seconds or several minutes.
How XRF and X-ray Diffraction (XRD) Can be Used Jointly
Though XRF and XRD operate on different principles, the two complement one another. XRF can explore the total amount of iron or calcium in a certain sample, while XRD can differentiate between different phases within crystalline material., These include but are not limited to rocks, oxidized metals, and minerals. Compounds such as CaO, Ca(OH)2, Fe3O4, and Fe can be isolated and quantified in different phases. Experts have concluded that combining the joint efforts of XRF and XRD will accrue better data and give a more comprehensive profile of any crystalline analyte.
Sources:
- Zhang, R., Li, L., Sultanbawa, Y., & Xu, Z. P. (2018). X-ray fluorescence imaging of metals and metalloids in biological systems. American journal of nuclear medicine and molecular imaging, 8(3), 169–188
- Montanha GS, Rodrigues ES, Marques JPR, de Almeida E, Dos Reis AR, Pereira de Carvalho HW. (2020) X-ray fluorescence spectroscopy (XRF) applied to plant science: challenges towards in vivo analysis of plants. Metallomics. 2020 Feb 26;12(2):183-192.
- Loïc Perring and Daniel Andrey. (2003) ED-XRF as a Tool for Rapid Minerals Control in Milk-Based Products Journal of Agricultural and Food Chemistry 2003 51 (15), 4207-4212
- Cristina García-Florentino, Maite Maguregui, Eva Marguí, Ignasi Queralt, Jose Antonio Carrero, and Juan Manuel Madariaga (2017) Development of X-ray Fluorescence Quantitative Methodologies To Analyze Aqueous and Acid Extracts from Building Materials Belonging to Cultural Heritage Analytical Chemistry 89 (7), 4246-4254
- Kouichi Tsuji, Takashi Ohmori, and Makoto Yamaguchi (2011) Wavelength Dispersive X-ray Fluorescence Imaging. Analytical Chemistry 83 (16), 6389-6394
- Gan TT, Zhang YJ, Zhao NJ, Yin GF, Xiao X, Zhang W, Liu JG, Liu WQ. (2016) Study of the Impact of Sample Thickness on Thin Film Method X-Ray Fluorescence Spectrum Measurement. Guang Pu Xue Yu Guang Pu Fen Xi. 36(12):4039-44. Chinese
- Medeiros, Vasco. (2021, December 14). Detecting Extraterrestrial Life Using Spectroscopy. AZoLifeSciences. https://www.azolifesciences.com/article/Detecting-Extraterrestrial-Life-Using-Spectroscopy.aspx.
Further Reading
Last Updated: Mar 7, 2022