One of the cannabis industry’s most rapidly expanding usage types is cartridges containing cannabis extract or CBD.1 Ongoing studies and increased insight into e-cigarette or vaping product use has revealed that certain additives may cause a lung injury (EVALI).
This newly discovered risk has resulted in the need for a more thorough understanding of the composition of cartridges used for vaporization (“vaping”).
EVALI is an acute or subacute respiratory illness that results from damage to the alveoli. EVALI can be severe and even life-threatening in some circumstances, prompting the Centers for Disease Control to regard illnesses related to vaping as a public health concern.
There have been 2,807 EVALI-related hospitalizations and 68 deaths reported as of February 2020.2
One potential cause of EVALI is the vitamin E acetate frequently utilized as a thickening agent in the production of vape oils on the illicit market.
The mechanism of action for this health issue is not currently well understood, but it has been suggested that this chemical’s sticky nature causes it to remain in the lungs, causing damage to the alveoli.3,4,5
Studies have found that health issues associated with EVALI were primarily due to users consuming illicit market e-cigarettes, cannabis and CBD vape products rather than products from the heavily regulated and tested legal cannabis markets.
The ongoing health risks around EVALI highlight the need for a robust analytical method capable of testing for vitamin E acetate (tocopherol acetate) in vape oil cartridges.
This analysis has been historically performed using HPLC with UV or PDA detection, but the sheer complexity and diversity of the cannabis and CBD matrix leads to interferences which can hinder rapid, accurate analysis.
This article presents a method for the comprehensive, accurate quantification of vitamin E acetate. It achieves this in under 3 minutes using LC/MS/MS and a PerkinElmer QSight® 420 triple quadrupole system.
Experimental
Hardware and software
A PerkinElmer LX50 UHPLC system was used to conduct chromatographic separation. This system featured the Solvent Delivery Module, Precision Sampling Module and Column Temperature Module.
A PerkinElmer QSight 420 MS/MS detector was used for detection via electrospray (ESI) ionization, while the Simplicity 3Q™ software platform was used for instrument control, data acquisition and data processing.
Sample preparation
A step-by-step sample preparation procedure for vape cartridge oil is presented below. This procedure involved a 1000-fold dilution for the ESI source.
- The vape cartridge was carefully opened to access the oil.
- A total of 1 g of extract was weighed into a 50 mL conical tube. In some cases, it may be necessary to utilize a heat gun to allow the transfer of contents, though this step can be skipped if the sample is not in its final packaging.
- The sample was centrifuged at 3000 rpm for a total of 5 minutes.
- A total of 10 mL of LC/MS grade acetonitrile was added to the tube before this was capped.
- The tube was placed in a balanced multi-tube vortex mixer before being vortexed for 10 minutes.
- The extract was centrifuged for 10 minutes at 3000 rpm.
- The supernatant was filtered into a 2 mL microcentrifuge tube before being capped using a 0.22 µm nylon syringe filter.
- A total of 10 µL of the supernatant was transferred into a 2 mL HPLC vial.
- A total of 10 µL of internal standard stock was added and this was diluted with 980 µL of LCMS grade acetonitrile.
- A total of 3 μL of sample was then injected for LC/MS/MS analysis.
It should be noted that the final dilution factor for data analysis and related calculations is 1,000.
LC method and MS source conditions
Table 1 displays the LC method and MS source parameters.
Table 1. LC Method and MS Source Conditions. Source: PerkinElmer Cannabis & Hemp Testing Solutions
| LC Conditions |
| LC Column |
PerkinElmer Quasar™ SPP Pesticides
(4.6 × 100 mm, 2.7 μm) (N9306880) |
Mobile Phase A
(ESI Method) |
2 mM Ammonium formate + 0.1% Formic Acid (in LC/MS grade water) |
Mobile Phase B
(ESI Method) |
2 mM ammonium formate + 0.1% Formic Acid (in LC/MS Grade Methanol) |
| Column Oven Temperature |
55 °C |
| Auto Sampler Temperature |
10 °C |
| Injection Volume |
3 μL |
| MS Source Conditions for ESI Source |
| ESI Voltage (Positive) |
+5100 V |
| Drying Gas |
150 arbitrary units |
| Nebulizer Gas |
450 arbitrary units |
Source Temperature
(ESI Method) |
425 °C |
HSID Temperature
(ESI Method) |
275 °C |
| Detection Mode |
Time-managed MRM™ |
Precision and accuracy
Repeatability is characterized as the degree of variance between samples prepared and analyzed within the same sample preparation batch or with the same set of parameters.
A limit of allowable precision for repeatability should ideally yield an RSDr (%) for the quality control sample of ≤ 20%.
Reproducibility is characterized as the degree of variance between samples prepared and analyzed under different conditions, for example, samples taken on different days, by different analysts, or using different instruments.
In the example presented here, samples were analyzed on several different days in order to evaluate the reproducibility of the method. Reproducibility should ideally yield an RSDR (%) result for quality control samples of ≤ 30%.
Accuracy or recovery is calculated as the percentage or fraction of the analyte recovered when the test sample is analyzed using the complete method. Recovery (%) should ideally yield values between 60% and 120%.
In the example presented here, recovery, repeatability and reproducibility were all within the ranges of acceptable validation. Table 2 provides information on LC/MS/MS results (n=10).
Table 2. Repeatability (RSDr), reproducibility (RSDR), and Recovery Results for the
Quality Control Sample Using LC/MS/MS. Source: PerkinElmer Cannabis & Hemp Testing Solutions
| Analyte |
RSDR % |
RSDr % |
Recovery % |
| Tocopherol Acetate |
6.93 |
2.37 |
98 |
Reportable range and linearity
Table 3 displays the analytical range for this method - 0.01 to 500 ppb. There is the possibility that an analyte higher than the highest calibration point will saturate the detector or cause issues with the column separation.
Table 3. Reportable Range for Each Matrix. Source: PerkinElmer Cannabis & Hemp Testing Solutions
| Matrix |
Min Range (ppm) |
Max Range* (ppm) |
| Vape Cart |
0.01 |
500 |
*(samples may be diluted further to bring analyte within calibration range, allowing
for a higher max range of the method)
Samples were diluted by a factor of 1,000 in order to minimize matrix effects and ensure that analyte concentrations remained within the linear range of calibration.
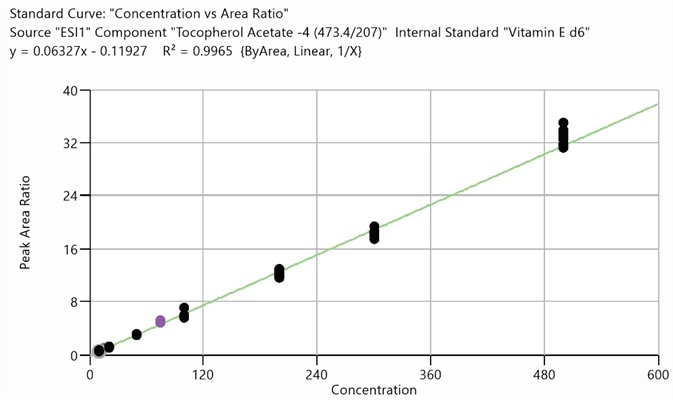
Figure 1. Calibration curve for tocopherol acetate, 10 ppb to 500 ppb (10 injections). Image Credit: PerkinElmer Cannabis & Hemp Testing Solutions
It is necessary to further dilute samples with high levels of analytes in order to bring the analyte signal within the linear calibration range. Figure 1 shows the calibration curve for tocopherol acetate.
The linear range can be understood as the detectable range of values between calibration level 1 and calibration level 7.
The linearity study in this example was performed over the course of five runs and was comprised of eight calibrators and at least 2 QC sets. State requirements defined the acceptability criteria (average R2= 0.995), and all calibration curves were found to possess an average R2 value which was greater than the required 0.995.
All analytes were analyzed with a weighting method of 1/X with a linear fit. Table 4 displays the observed R2 values for this example.
Table 4. Calculated R² Values for Vitamin E Acetate. Source: PerkinElmer Cannabis & Hemp Testing Solutions
| Analyte |
Min R2 Observed |
Max R2 Observed |
Average R2 |
| Tocopherol Acetate |
0.9909 |
0.9975 |
0.995 |
LOD and LOQ
The LOD can be understood as the lowest amount of analyte distinguishable from the background. This method defined the LOD as a level of signal 3.3 times larger than background, with > 99% confidence that the signal is not comprised of random noise.
Here, the LOD was calculated as the inverse of the signal-to-noise ratio, multiplied by the calculated concentration of the analyte, times a factor of 3.3.
The LOQ can be understood as the lowest amount of signal that is quantifiable by the method. This is typically calculated as 10 times the signal-to-noise ratio.
This method calculated the LOQ as the inverse of the signal-to-noise ratio, multiplied by the calculated concentration of the analyte, times a factor of 10.
The LOD and LOQ of LC/MS/MS were both calculated using the calculated concentration and signal-to-noise ratio for each analyte peak that detected for each specific calibrator point on the curve.
The average for all calibrator points was calculated to determine the LOD and LOQ. The equations employed were:
LOD = 3.3 * C * (S/N)-1 LOQ = 10 * C * (S/N)-1
WHERE:
- C = Calculated Concentration
- N = Noise
- S= Signal
Calculated LOQ values were established over the run, and these were all found to be below the action level for each analyte. This verified that the analytical measurement range was satisfactory, and the instrument’s analytical sensitivity is sufficient for the assay. Table 5 displays the calculated LC/MS/MS results.
Table 5. Average Calculated LOD and LOQ Results for Vitamin E Acetate by LC/MS/MS. Source: PerkinElmer Cannabis & Hemp Testing Solutions
| Analyte |
LOD (ppm) |
LOQ (ppm) |
Action Limit (ppm) |
| Tocopherol Acetate |
0.0001 |
0.0004 |
100 |
Interference and analytical selectivity
The nature of the analytical method meant that the selectivity of method had to be evaluated by comparing the signal and retention time of two MRM transitions. This ensures proper quantification of false negative or false positive values in dirty or complex matrices like cannabis.
Internal standards were used to quantify the number of analytes in both known and unknown samples. This helped to reduce interferences from matrix effects and ensured increased accuracy.
It was also important to ensure that the matrix did not impact the level of the detected analyte. To help avoid this, a certified blank CRM of hemp oil (Absolute Standards PN 54995) prepared with acetonitrile was utilized in the preparation of a new set of QC and calibration standards.
Recovery was required to be 60-120% and RSDr was required to be < 20% for this new curve and sample to be acceptable. The concentrate matrix was diluted by a factor of 1,000 in order to match the sample preparation conditions already utilized.
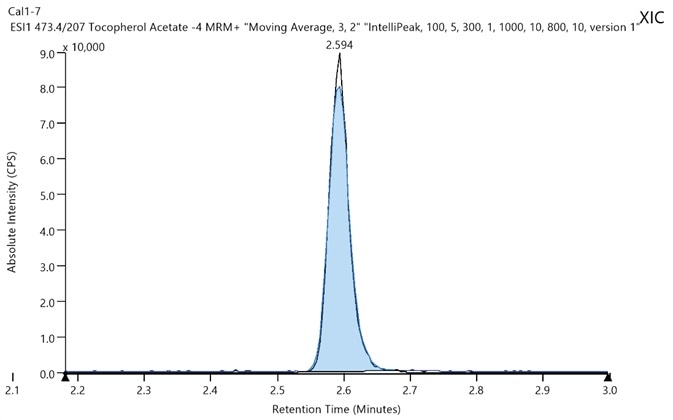
Figure 2. Chromatogram of tocopherol acetate at its LLOQ (10 ppb). Image Credit: PerkinElmer Cannabis & Hemp Testing Solutions
The resulting data (Table 6) indicated that calibrators and QC prepared neat are equivalent to those within hemp oil and likely those in vaping products. The chromatogram of the LLOQ was strong and distinctive (Figure 2), demonstrating almost negligible matrix related interferences.
Table 6. Repeatability (RSDr), and Recovery Results for the Concentrate Matrix of
Quality Control Sample Using LC/MS/MS. Source: PerkinElmer Cannabis & Hemp Testing Solutions
| Analyte |
RSDr % (MQC) |
Recovery % (MQC) |
| Tocopherol Acetate |
7.51 |
96 |
Carryover
In order to monitor carryover, eight negative QC samples were evaluated, directly followed by a corresponding high-quality control sample vial. This enabled an evaluation of the ability of the autosampler to efficiently rinse between samples, as well as solvents used and the LC wash method.
It is vital that carryover is analyzed when working with samples containing significant amounts of analyte because these are prone to sticking within the system.
Results displayed in Table 7 confirm an insignificant amount of carryover for each analyte, even when working with high concentration vials. This confirms that the LC instrument performs sufficient washing steps after each sample is injected.
Table 7. Results for Carryover for Vitamin E Acetate by LC/MS/MS. Source: PerkinElmer Cannabis & Hemp Testing Solutions
| Analyte |
% Calculated Carryover
from Blank |
Pass ≤ 25 % of LLOQ
(Yes or No) |
| Tocopherol Acetate |
0 |
Yes |
Conclusions
The examples presented here demonstrate a distinct, rapid and reliable quantitative LC/MS/MS method using an ESI source. This method is ideal for the analysis of vitamin E acetate in cannabis and CBD vape samples.
The method outlined here saw vitamin E acetate successfully quantified with an ESI source, with a run time of under 3 minutes.
The sample preparation method and analysis proposed an overall recovery of 98%. Repeatability (RSDr) values are under 7%, with reproducibility (RSDR) values under 3%.
The method successfully facilitated the identification and quantification of vitamin E acetate in cannabis concentrate samples at levels (0.0004 μg/g) below required state action limits.
This illustrates the potential of LC/MS/MS as an efficient, robust and novel single-instrument means of screening and quantitating vitamin E acetate in cannabis and CBD vape samples.
References
- https://www.businesswire.com/news/home/20200109005260/en/ New-Report-Cannabis-Concentrate-Sales-Plummet-Post-Vape.
- CDC https://www.cdc.gov/.
- Boudi et al. Vitamin E Acetate as a Plausible Cause of Acute Vaping-related Illness. Cureus. 2019 Dec; 11(12): e6350. Published online 2019 Dec 11. doi: 10.7759/cureus.6350
- Ansari-Gilani et al. E-cigarette use related lung disease, review of clinical and imaging findings in 3 cases. Heart and Lung. 2020 (000) 1-5.
- Duffy et al. Analysis of Cannabinoid-Containing Fluids in Illicit Vaping Cartridges Recovered from Pulmonary Injury Patients: Identification of Vitamin E Acetate as a Major Diluent. Toxics 2020, 8(1), 8; https://doi.org/10.3390/toxics8010008.
Acknowledgments
Produced from materials originally authored by Manik Gudimani and Megan Steltz from CanLab US; and Margaret Guthrie, Avinash Dalmia, Jason Weisenseel, and Toby Astill from PerkinElmer.
About PerkinElmer Cannabis & Hemp Testing Solutions
 With the cannabis and hemp markets continuing to grow rapidly and regulations strengthening, labs increasingly need streamlined access to best-in-class testing solutions geared toward the unique requirements of the industry. Whether your lab is well established or just starting up, PerkinElmer is a single-source vendor for instruments, methods, reagents, and consumables on hand to help enhance your testing capacity and get ahead of the competition.
They help drive analytical best practices and operating procedures and commit to ensuring your laboratory has maximum uptime. Learn about their various instruments, testing methods, and applications for cannabis analyses. Let them work with you to build an efficient workflow, so you can focus on growing your business.
Sponsored Content Policy: AZO Life Science publishes articles and related content that may be derived from sources where we have existing commercial relationships, provided such content adds value to the core editorial ethos of AZO Life Science, which is to educate and inform site visitors interested in medical research, science, medical devices, and treatments.