Chemometrics is the science of extracting information from chemical systems and applied to both descriptive and predictive problems in fields such as chemistry, biochemistry, life science, bioscience, biophysics, medicine, biology, and chemical engineering.

Image Credit: Rabbitmindphoto/Shutterstock.com
In descriptive applications, properties of chemical systems are modeled to understand the underlying structure and physicochemical interactions of the system. In predictive applications, properties of chemical systems are modeled for predicting new properties or biochemical trends. In both cases, the datasets are usually large and multivariate.
Chemometric techniques are particularly used in analytical/physical chemistry and metabolomics, and instrumentation and methods are advanced by the improvement of chemometric methods. Typically, the use of chemometrics is applied to spectral datasets generated by spectroscopic techniques, some of which include Raman, FT-IR, UV-Vis, and fluorescence spectroscopy.
Several chemometric methods isolate key information in spectral datasets as well as classify and predict, some of which are discussed below.
Principal Components Analysis (PCA)
Principal Components Analysis (PCA) constitutes the most fundamental technique used in chemometrics data analysis and involves the decomposition of data into noise and structural components.
The dimensionality of the data set is reduced by plotting the objects (sample spectra) as scores onto principal components (PCs) with each consecutive component orthogonally positioned concerning the previous PC. Each PC gives rise to a percentage of variance in the data set, with the explained variance decreasing as the PC increases. Hence, PC1 would give rise to the most variance in the data set followed by PC2, and so on.
Individual spectra are represented as a point or score on a two-dimensional score plot. The individual variance contribution of the spectrum for each point contributes to the position of each point (spectrum) on a given PC. A plot of these scores (scores plot) shows the location of the sample spectrum along with each model component orthogonally positioned to each other in three-dimensional space and plots the data points as positive or negative scores along these axes.
A plot of the scores along each PC (scores plot) allows differences and similarities to be easily recognized. The loadings in a loadings plot represent the variables (wavenumber values) responsible for the most vulnerability in the dataset and can be used in combination with the scores plot to identify the group to which they belong. If a variable has a large positive or negative loading, then those variables are the most important for the component concerned.
The positive and negative loadings are representative of the positive and negative scores respectively. However, if a PCA decomposition was performed on second derivative spectra, then the positive and negative scores are correlated with the negative and positive loadings respectively.
Unsupervised Hierarchical Cluster Analysis
Unsupervised hierarchical cluster analysis (UHCA) is an unsupervised technique used to classify areas of a cluster image based on the grouping of similar spectra within an image. Spectra are clustered into color-coded groups to form an image. UHCA allows the extraction of the mean spectrum which is most representative of the cluster.
Cluster analysis refers to methods used to assign objects (spectra) into groups (clusters) so that objects from the same cluster are more similar to each other than objects from different clusters. Hierarchical cluster analysis is a general approach to cluster analysis, in which spectra are grouped with other similar spectra.
Often similarity is assessed according to a distance measure. The calculation of distance measures between spectra and clusters, once spectra begin to group into clusters, is a key component of the analysis.
Artificial Neural Networks
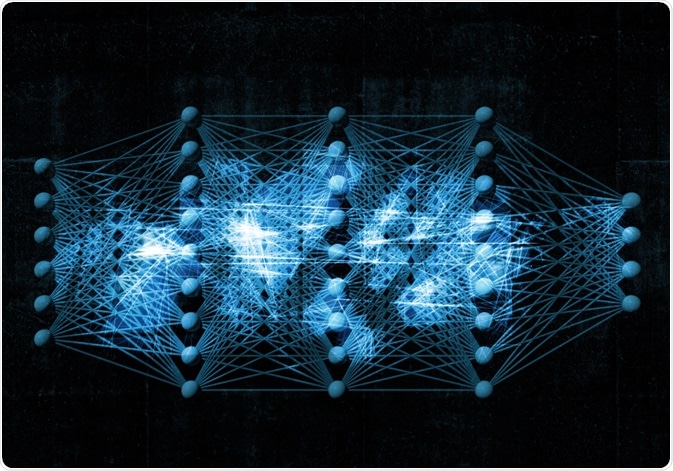
Artificial neural networks (ANN) are modeled on the biological neural network of the human brain. Within the framework of multivariate classification, ANNs are generally defined as non-parametric non-linear regression estimators, where non-parametric methods are not based on the a priori assumption of a specific model dataset.
Neural networks have several advantages over other data analysis methods such as linear discriminant analysis (LDA) and soft independent modeling by class analogy (SIMCA). First, ANNs are intuitive and can learn from new data; second, the networks can classify non-linear relationships among the input variables of the dataset; third, the networks can correctly classify new data that only generally resembles the original training dataset.
Finally, ANNs are computationally very fast because many independent training operations can be executed concurrently due to their highly parallel network structure. A drawback to the flexibility of the ANN model is their tendency to over-fit calibration data, which may result in a lack of generalization.
Generalization refers to the capability of a model to produce a valid estimate of the correct output when a new input is presented to the ANN. To guard against overtraining, validation datasets are used and monitored. Another drawback of ANNs is their black-box aspect. The black-box aspect of ANNs refers to the difficulty of examining the model’s internal structure to identify which spectral features are the most statistically significant for making the classifications.

Image Credit: Evannovostro/Shutterstock.com
References
- Esbensen, K. H. Multivariate data analysis in practice: An introduction to multivariate data analysis and experimental design, 5 ed.; CAMO ASA: Norway, 2001.
- Solomonov, I.; Osipova, M.; Feldman, Y.; Baehtz, C.; Kjaer, K.; Robinson, I. K.; Webster, G. T.; McNaughton, D.; Wood, B. R.; Weissbuch, I.; Leiserowitz, L. J. Am. Chem. Soc. 2007, 129, 2615-2627.
- Wood, B. R.; McNaughton, D. Spectrochemical Analyses Using Multichannel Infrared Detectors; Blackwell: Cambridge, MA, 2005.
- Despagne, F.; Massart, D. L. Analyst, 1998, 123, 157R-178R
Further Reading
Last Updated: Jul 6, 2020