All analytical signals are comprised of two components. These are the signal, which equates to target information, and the noise, which is fluctuations in a certain signal. These fluctuations are often random and are expressed as the standard deviation (σ or s). A given signal can be thought of as the sum of all signals at one specific frequency (x̄).

Image Credit: majcot/Shutterstock.com
Most instrument signals embody voltage or current that is quickly converted to voltage, coming out of a transducer. This signal-to-noise ratio (S/N), in laymen’s terms expressed as x̄/σ, refers to how clear a signal is relative to how “noisy” these random fluctuations are.
A nuclear magnetic resonance (NMR) spectrum can be used as a clear example of this. The (S/N) of the free induction decay (FID), referring to the short-lived sinusoidal electromagnetic signal, ultimately determines the S/N in the spectra.
Varieties of noise
The noise itself embodies all fluctuations outside of the target signal. However, this noise can originate from many different places, resulting in many different readings. In analytical chemistry, it is vital to decern the characteristics of noise that are produced, and the magnitudes of their consequence.
Chemical noise is a common characteristic, resulting from random interactions between molecules in a medium. On a macro scale humidity and chemical fumes can produce this chemical noise, as do small temperature and pressure fluctuations that alter the equilibria. To minimize this noise and obtain an accurate reading, one must control the system environment.
Instrumental noise is another characteristic, one that can be meticulously controlled but never eliminated. This noise results from temperature fluctuations that are given off by the electronics themselves, as well as random events in resistive electronics. Radiofrequency of electromagnetic radiation within the vicinity also falls under this category of instrumental noise and can jeopardize the veracity of a given signal. The only way this noise can be minimized is through the construction of the instrument.
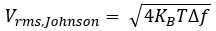
Thermal noise, a subsection of chemical noise, is a voltage caused by random motion from thermal processes in electronic components and is expressed in the following formula
Short noise results from the quantized nature of electrical charges in diodes and transistors, can be expressed in this formula:
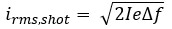
In this equation “I” represents the average direct current (DC) and is often related to the analytical signal. A general rule of thumb within analytical chemistry is that a larger analytical signal is desired, though this often incorporates an undesired increase in short noise.
The combination of thermal and short noise is referred to as “white noise”, and the duo is bandwidth dependent rather than frequency-dependent. The bandwidth (expressed as Δf ) represents the difference between the largest and the smallest frequencies in a system.
Scrupulous and painstaking readings, resulting in the greatest accuracy is the cornerstone of analytical chemistry, and yet some sources of noise are not fully understood. Flicker noise, sometimes dubbed as pink noise ( ) is a constant enigmatic phenomenon that becomes important to quantify at lower frequencies.
In contrast, environmental noise originates from many known sources, like radiofrequency pollution or humidity. This can be minimized with the use of a faraday cage, which incorporates an electrically grounded screen, foil, or metal container, and is the main reason why instrumentation and computers are packaged in metal boxes.
How to improve the signal to noise ratio (S/N)
The signal-to-noise ratio is a fundamental metric for a set of DC measurements, which again, roughly translates to the mean over the standard deviation.
To improve the S/N ratio of any instrument, one could perform ensemble averaging, which is where you average together the repeated measurements, much like an NMR or a Fourier transformer does. It is important to note that ensemble averaging will only increase the signal-to-noise ratio if the noise itself is random. The averaging of repeated measurements can be accomplished through various means, such as RC filters or lock amplifiers performing lock in-detection/demodulation.
RC filters – Passive filters
RC Filters are used to change the frequency content of a signal. An RC filter is comprised of a resistor and a capacitor. The original signal goes in, and the filtered signal comes out. The science behind this apparatus works because the voltage on the capacitor cannot instantaneously change.
When you have a resistor that slows the current of the capacitor, your output voltage might not be able to follow the sudden changes in the input voltage. As a result, higher frequencies can be filtered out, yielding a filtered signal.
Lock-in amplifiers
These lock-in amplifiers are one of the most prominent tools in the current physics and engineering labs of today. Their goal is to obtain an input signal, which includes the noise as well as the reference signal and guides them through a frequency mixer. This will result in a signal and an almost identical reference frequency. This principle of mixing the single and passing it through a filter is called demodulation and works under the basis of the Fourier theorem.
This Fourier theorem states that every periodic function can be extended to an infinite sum of linearly independent functions in terms of sine and cosine terms. Demodulation, when applied to such an expression, filters frequencies that are within one filter bandwidth of the reference signal, essentially filtering out excess noise and outliers.
If done infinitely, this is likely to reduce the infinite sum to a single sine and cosine term. This converts all other frequency component averages to zero, effectivity eliminating noise.
Sources:
- M. Farooq Wahab, Arved E. Reising (2018). The Ultimate Limit in Measurements by Instrumental Analysis: An Interesting Account of Schroteffekt and Shot Noise. Journal of Chemical Education 95 (9), 1668-1671
- G. M. Hieftje (1972). Signal-to-noise enhancement through instrumental techniques. 1. Signals, noise, and S/N enhancement in the frequency domain. Analytical Chemistry 44 (6), 81A-88a
- M. Jaffar, S. Noorullah Hussani, and Ijaz-ur Rehman (1985). An RC filter for automatic differential potentiometry. Journal of Chemical Education 62, (1), 88
- T. C. O'Haver (1972). Lock-in amplifiers - Part I. Journal of Chemical Education 49 (3), A131
- T. C. O'Haver (1972). Lock-in amplifiers - Part II. Journal of Chemical Education 49 (4), A211
Further Reading
Last Updated: Oct 21, 2021