The Ultima 2Pplus offers the ideal balance of flexibility, resolution, imaging depth, and speed, thanks to new developments in its field of view, sensitivity, wavelength, and sample accommodation capabilities. This enables users to carry out simultaneous imaging, stimulation, and electrophysiology protocols more effectively and efficiently.
The system is specifically designed for intravital imaging, with fully motorized control of the objective's X-Y-Z position and two axes of rotation to ensure precise imaging orientation. A second scan route allows for simultaneous imaging and photoactivation. The system’s improved optical train provides remarkable performance at the very edges of the broad field.
Add-on modules improve the microscope's capabilities. NeuraLight 3D Ultra provides the most sophisticated 3D holographic workstation for concurrent all-optical stimulation and imaging. NeuraLeap is a ground-breaking Digital Micromirror Device that facilitates rapid imaging across a range of depths with higher temporal resolution. The OptoVolt module provides unprecedented kilohertz imaging rates for voltage imaging neural research, and the new xView exchangeable lens set expands the field of view (FOV) by more than 2.5 times the standard area.
- Class-leading field of view: Provides a more complete picture with each scan
- Simultaneous imaging and photoactivation: Cells are precisely timed and spatially recorded
- High-efficiency light collection and detection: Deeper images with higher signal-to-noise ratios
Features
Engineered for High-Performance Imaging
Ultima 2Pplus: All‑Optical Multiphoton Platform | Fluorescence Microscopy Explained
Video Credit: Bruker Nano Surfaces and Metrology
The Ultima 2Pplus revolutionizes multiphoton imaging with a wider field of view, increased sensitivity, and deeper imaging capability, offering high-quality data with no compromises. Specifically designed for intravital imaging, it combines sophisticated scanning, accurate sample management, and a tailored optical route to achieve deep, wide-field imaging in live systems.
For researchers, this means speedier tests, better picture quality at depth, and the capacity to view and alter neural activity in larger, more complicated biological networks.
Largest Field of View and Superior Field Uniformity
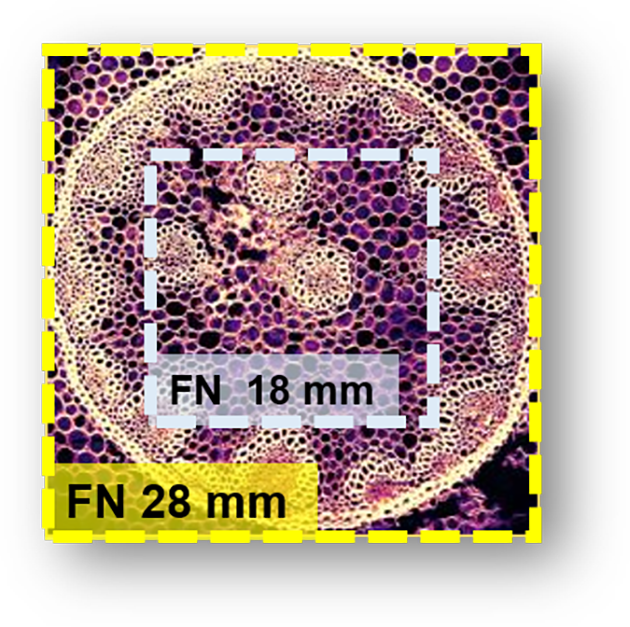
The field of view on the Ultima 2Pplus is FN 28 mm in comparison to the industry standard of FN 18 mm. Image Credit: Bruker Nano Surfaces and Metrology
The Ultima 2Pplus field of view is more than 50% larger, aiding current optogenetics investigations that demand imaging and photostimulation of remote locations in a sample. A new, custom optical design maintains spatial and temporal resolution over the whole field, allowing researchers to continue their work without altering experimental designs.
High-Sensitivity Deep Imaging
Nearly all photons dispersed from opaque, thick, and dim biological materials are detected, thanks to the Ultima 2Pplus light-collection path. Up to the sensitive close-proximity detectors, two-inch or larger optics are used throughout the emission path to achieve higher collection efficiency.
Emerging three-photon microscopy offers the possibility of seeing much deeper into materials. Three-photon excitation provides the potential to image several millimeters into the brain since longer infrared wavelengths are much less dispersed. The Ultima 2Pplus system leverages this ability to aid researchers.
Perfected Photostimulation and Imaging
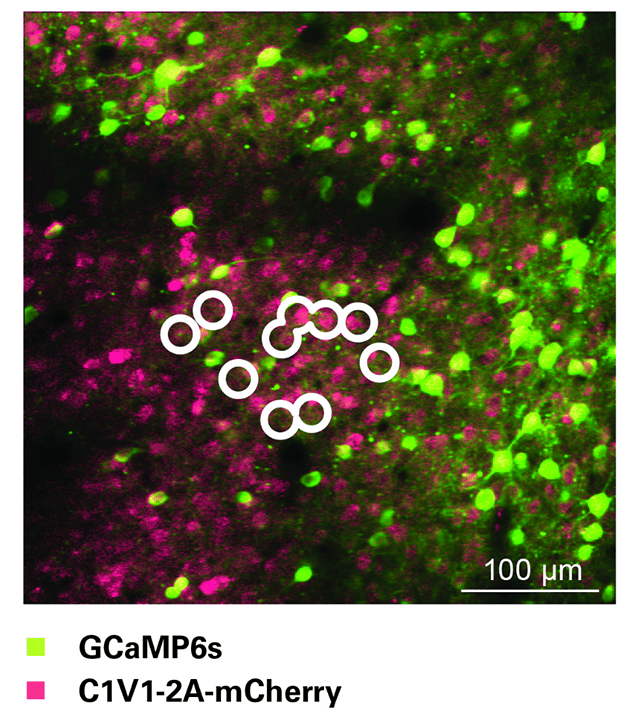
Optical stimulation of circled cells with Neuralight 3D. A 3D hologram of points was created and then scanned in a spiral over neuronal cell bodies. Data Courtesy of Adam Packer, Lloyd Russell, Henry Dalgleish, Michael Häusser’s lab, UCL, London. Image Credit: Bruker Nano Surfaces and Metrology
The Ultima 2Pplus is equipped with Bruker’s innovative Neuralight 3D Ultra Spatial Light Modulator, allowing for complex optogenetic experiments. Computer-generated holograms can be used to activate large populations of targets at the same time over various focal planes.
During 3D holographic experiments, targets at various depths are imaged using a custom-designed, optically corrected ETL focusing module that enables independent Z-positioning of the imaging plane relative to photostimulation.
Bruker's two-photon calcium imaging, eletrotunable lens (ETL), and spatial light modulator (SLM) were employed to map long-range all-optical connectivity and investigate feedback in the mouse brain.
Michael Hausser's lab has lately produced amazing results using Bruker's OptoVolt Module on the Ultima 2Pplus. They carefully investigated the spatiotemporal interactions among hippocampal CA1 neurons using OptoVolt in 8× mode.
Additional modules are available to expand the microscope’s capabilities.
Applications
Ultima 2Pplus Data Gallery
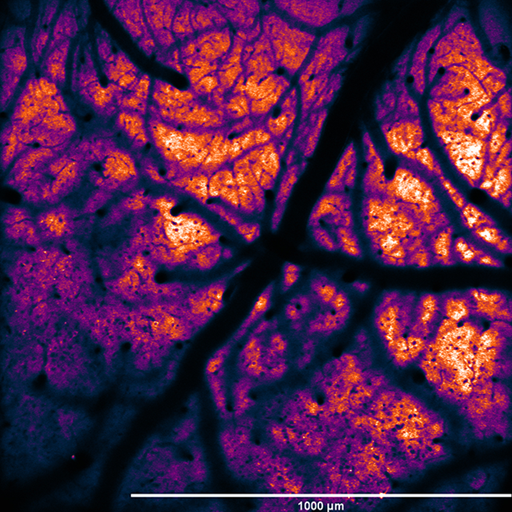
1.345 mm x 1.345 mm FOV, resonant scanned image of GCaMP-expressing cells in a mouse brain. Image Credit: Bruker Nano Surfaces and Metrology
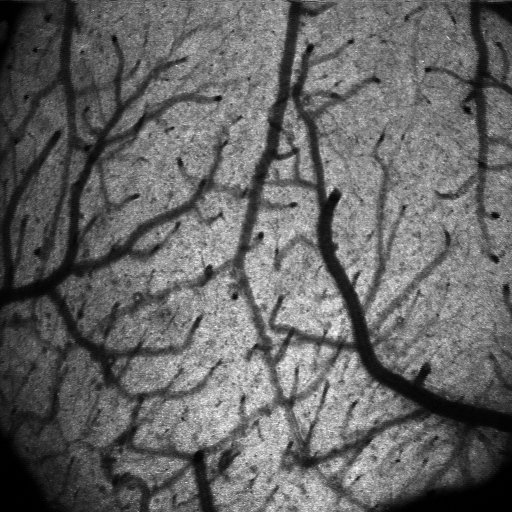
Two-photon imaging of a cortical surface with Ultima 2Pplus through a cranial glass window (gray). Acquired with Nikon 16x 0.8 NA objective at 920 nm. Data courtesy of Dustin Herrmann, Mehmet Fisek, Michael Häusser's lab, UCL, UK. Image Credit: Bruker Nano Surfaces and Metrology
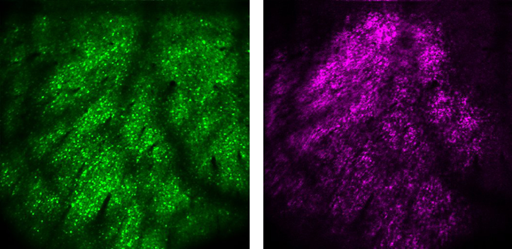
Co-expression of GCaMP6s (green) and soma-restricted C1V1-mRuby2 (magenta) in layer 5A neurons of mouse visual cortex at a depth of ~ 400 μm below the pia (right). Both acquired with Nikon 16x 0.8 NA objective at 920 nm. Data courtesy of Dustin Herrmann, Mehmet Fisek, Michael Häusser's lab, UCL, UK. Image Credit: Bruker Nano Surfaces and Metrology
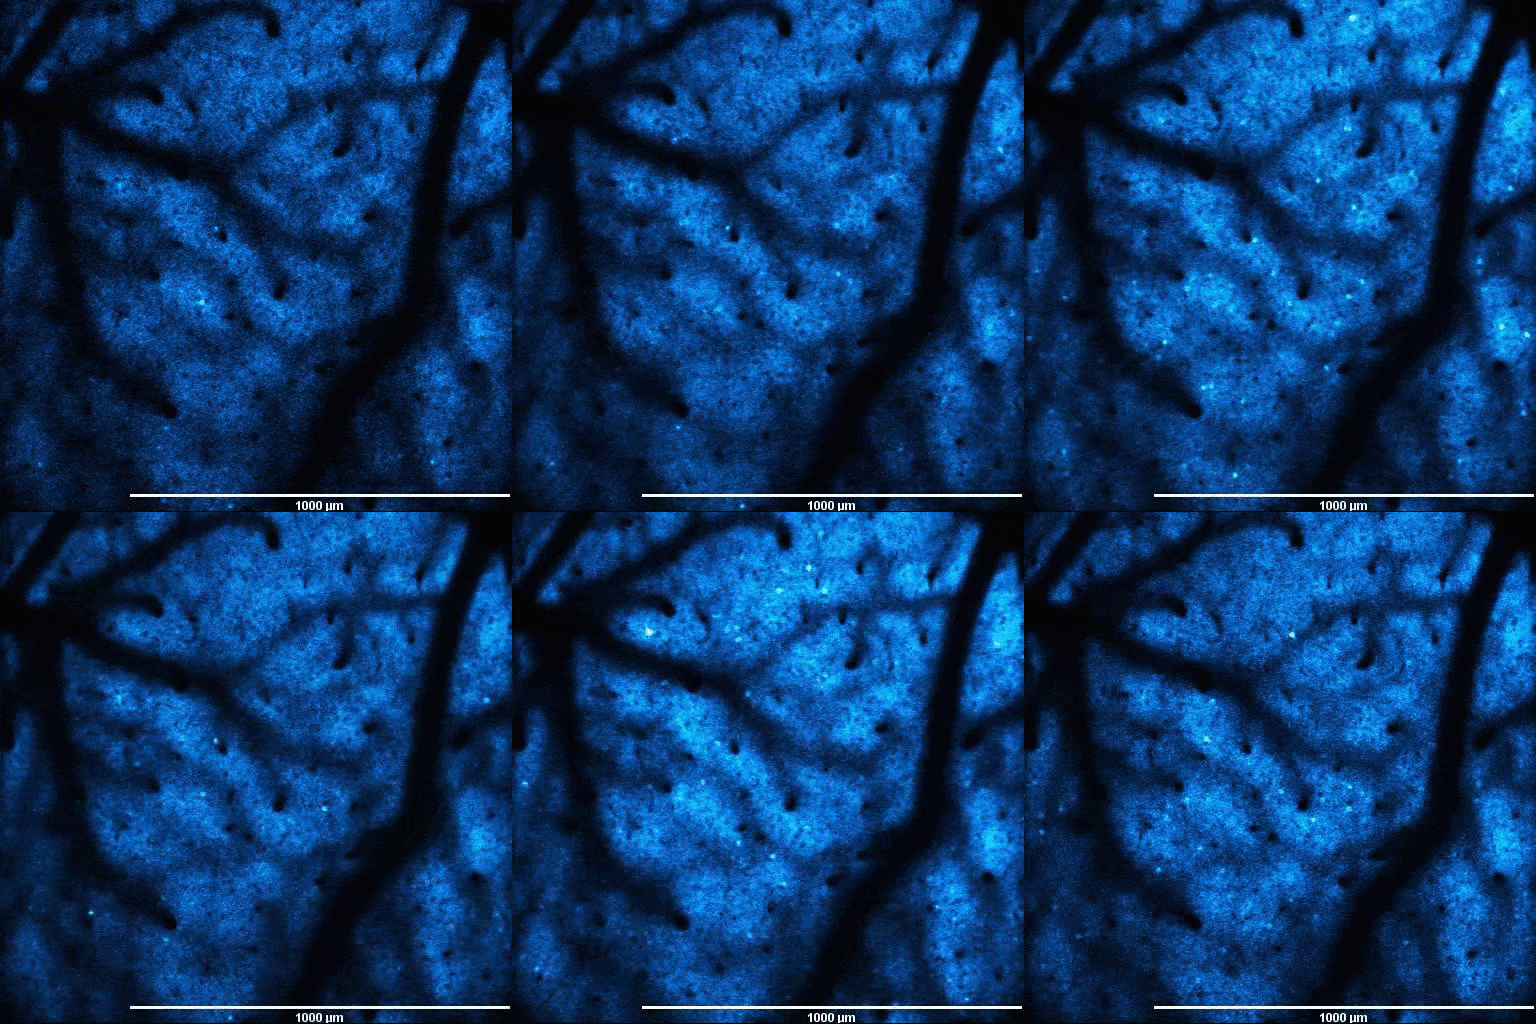
Spontaneous fluorescence fluctuations in neurons expressing GCaMP6 in a transgenic mouse. Data courtesy of Robert Lees, James Rowland, Adam Packer Lab, University of Oxford, UK. Image Credit: Bruker Nano Surfaces and Metrology
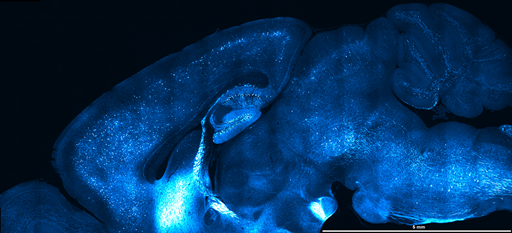
Large FOV montage (44 on scope with FN28 vs 108 tiles on scope with FN18) of hippocampal slice and details of selected tile. In-house data. Image Credit: Bruker Nano Surfaces and Metrology
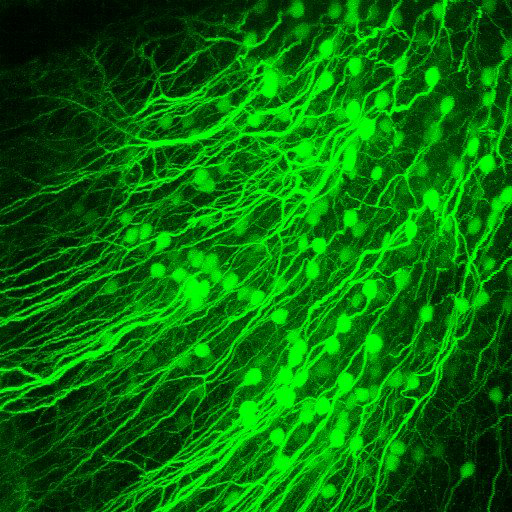
3D view of volumetric stack recorded using the ETL focusing module. Layer 5B neurons in a mouse visual cortex in vivo, labeled with tdTomato. Scale bar 100 μm. Data courtesy of Lisa Bauer, Dustin Herrmann, Mehmet Fisek, Michael Häusser's lab, UCL, UK. Image Credit: Bruker Nano Surfaces and Metrology
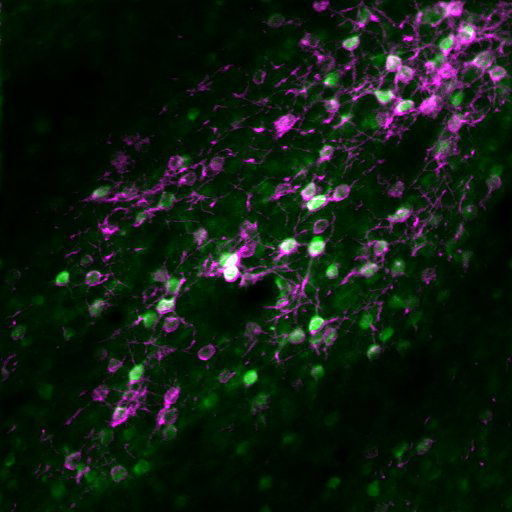
Co-expression of GCaMP6s and soma-restricted C1V1-mRuby2 in layer 5A neurons of mouse visual cortex. Acquired in vivo, ~ 400 μm below pia at wavelengths 920 nm and 765 nm. Data courtesy of Dustin Herrmann, Mehmet Fisek, Michael Hausser's lab, UCL, UK. Image Credit: Bruker Nano Surfaces and Metrology
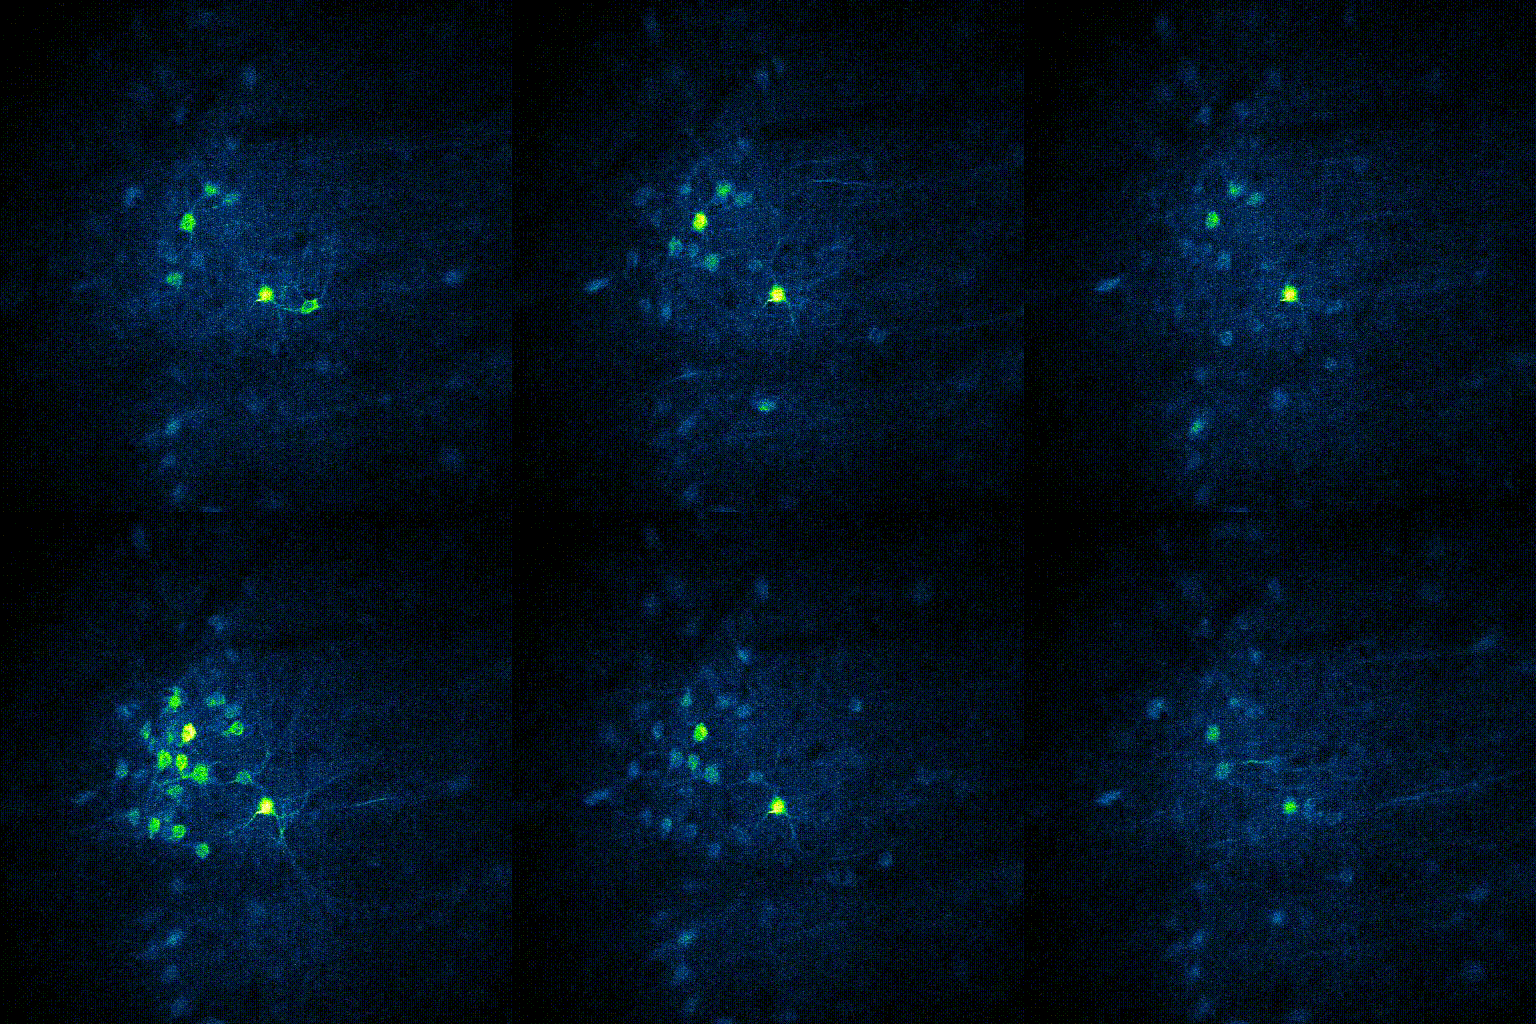
Holographic photostimulation of neurons expressing GCaMP6 and ChRmine in OFC through a 4.2 mm grin lens. Data courtesy of Vijay Namboodiri, Charles Zhou, Garret Stuber Lab, University of Washington, WA. Image Credit: Bruker Nano Surfaces and Metrology
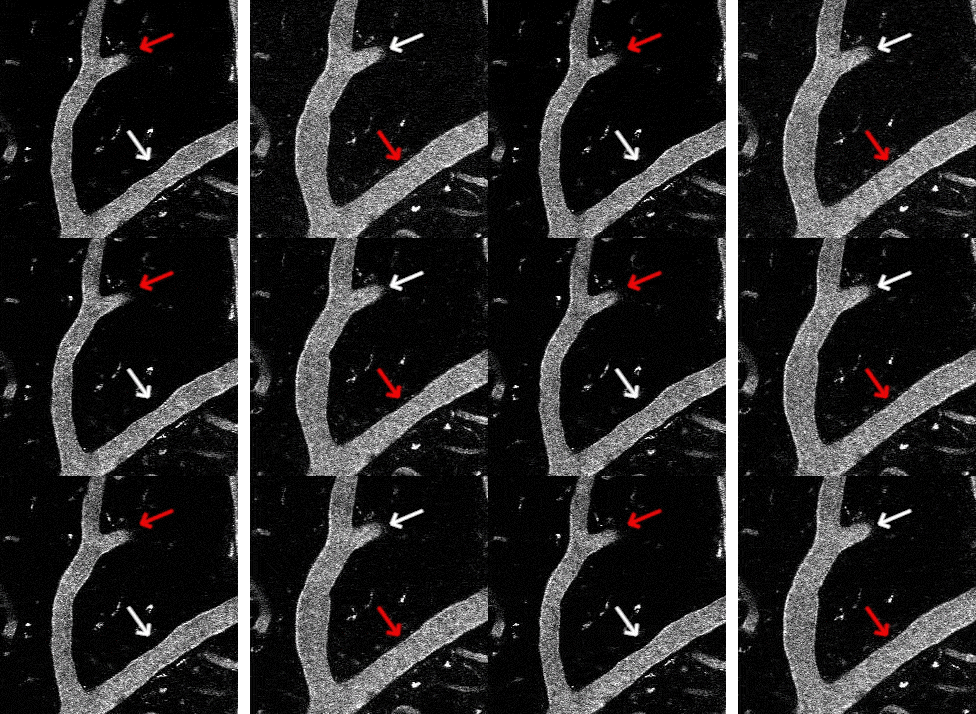
Two-photon activation leads to focal constriction. The SLM focused six spots at the location indicated by the red arrow. The total stimulation power was ~ 200 mW spread over the six spots, with three adjacent spots on either side of the vessel. Each spot was scanned in a 12 μm diameter spiral for 100 ms. The white arrow is for comparison. Vessels are labeled with Texas Red Dextran. Speed 4x real time. Data courtesy of Phil O'Herron, University of Augusta, Augusta, GA. Image Credit: Bruker Nano Surfaces and Metrology
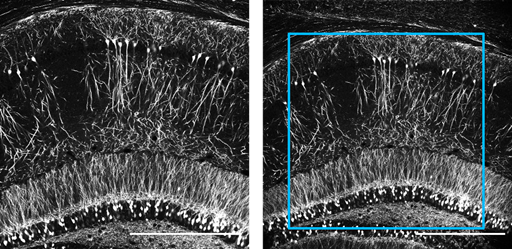
Comparison of FOV between 1x zoom (left) and 0.8x zoom (right) in galvo-galvo mode. Image Credit: Bruker Nano Surfaces and Metrology
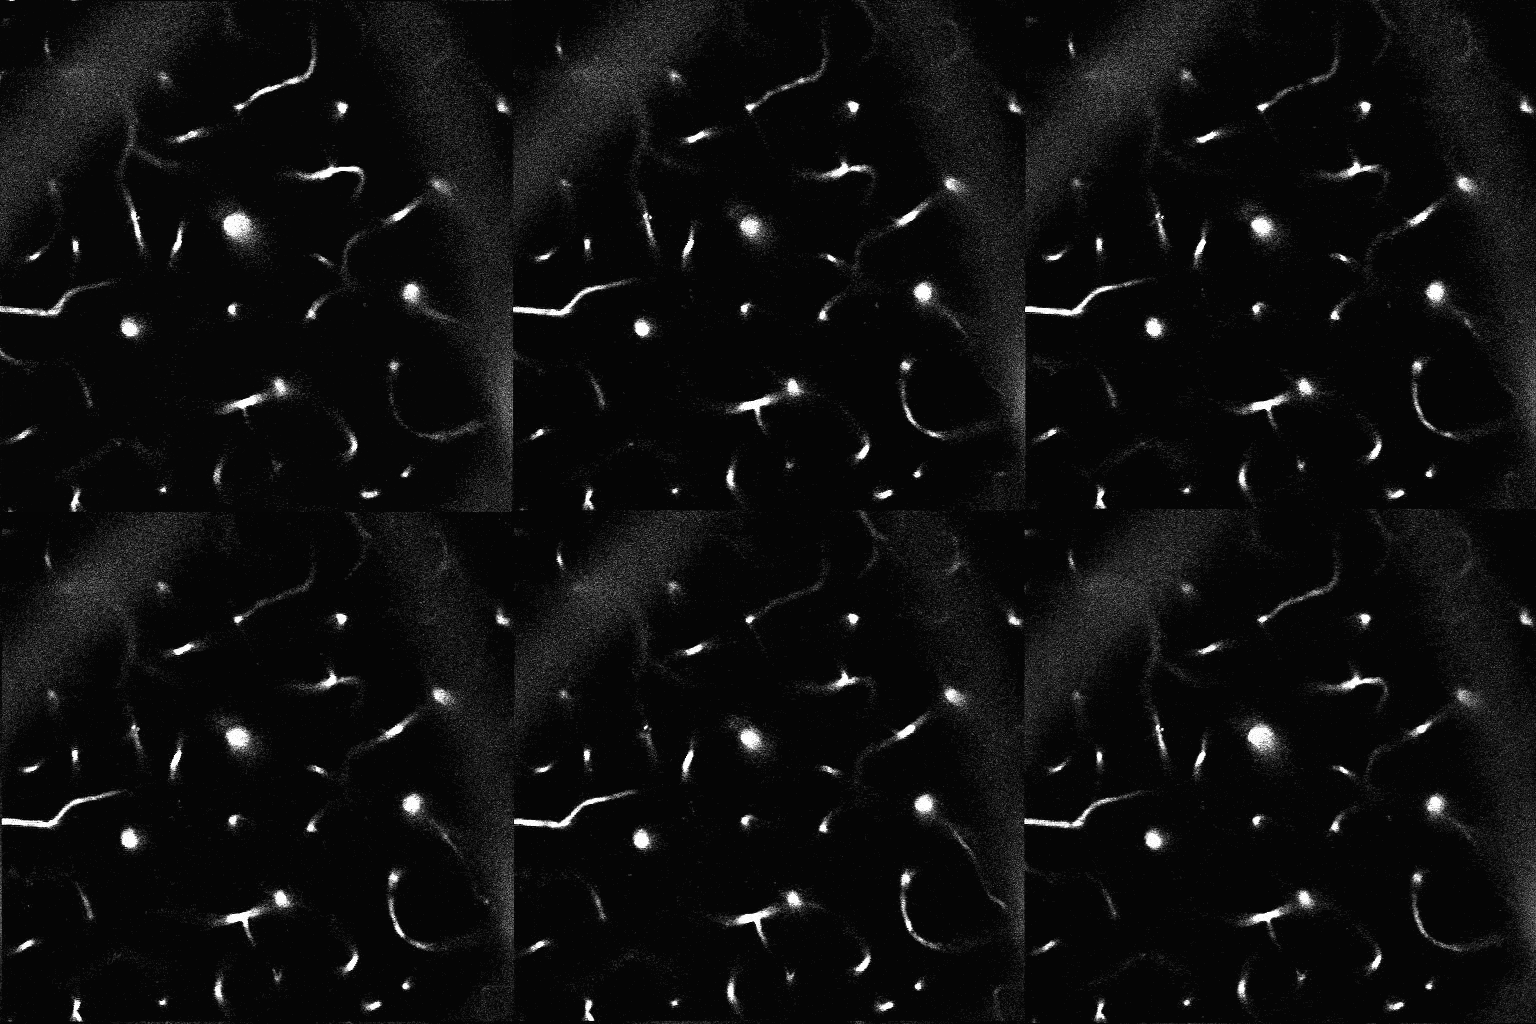
Constriction of a penetrating arteriole with the 594 nm LED. Five pulses of 100 ms duration, with 100 ms in between, were presented. Speed 4x real time. Data courtesy of Phil O'Herron, University of Augusta, Augusta, GA. Image Credit: Bruker Nano Surfaces and Metrology
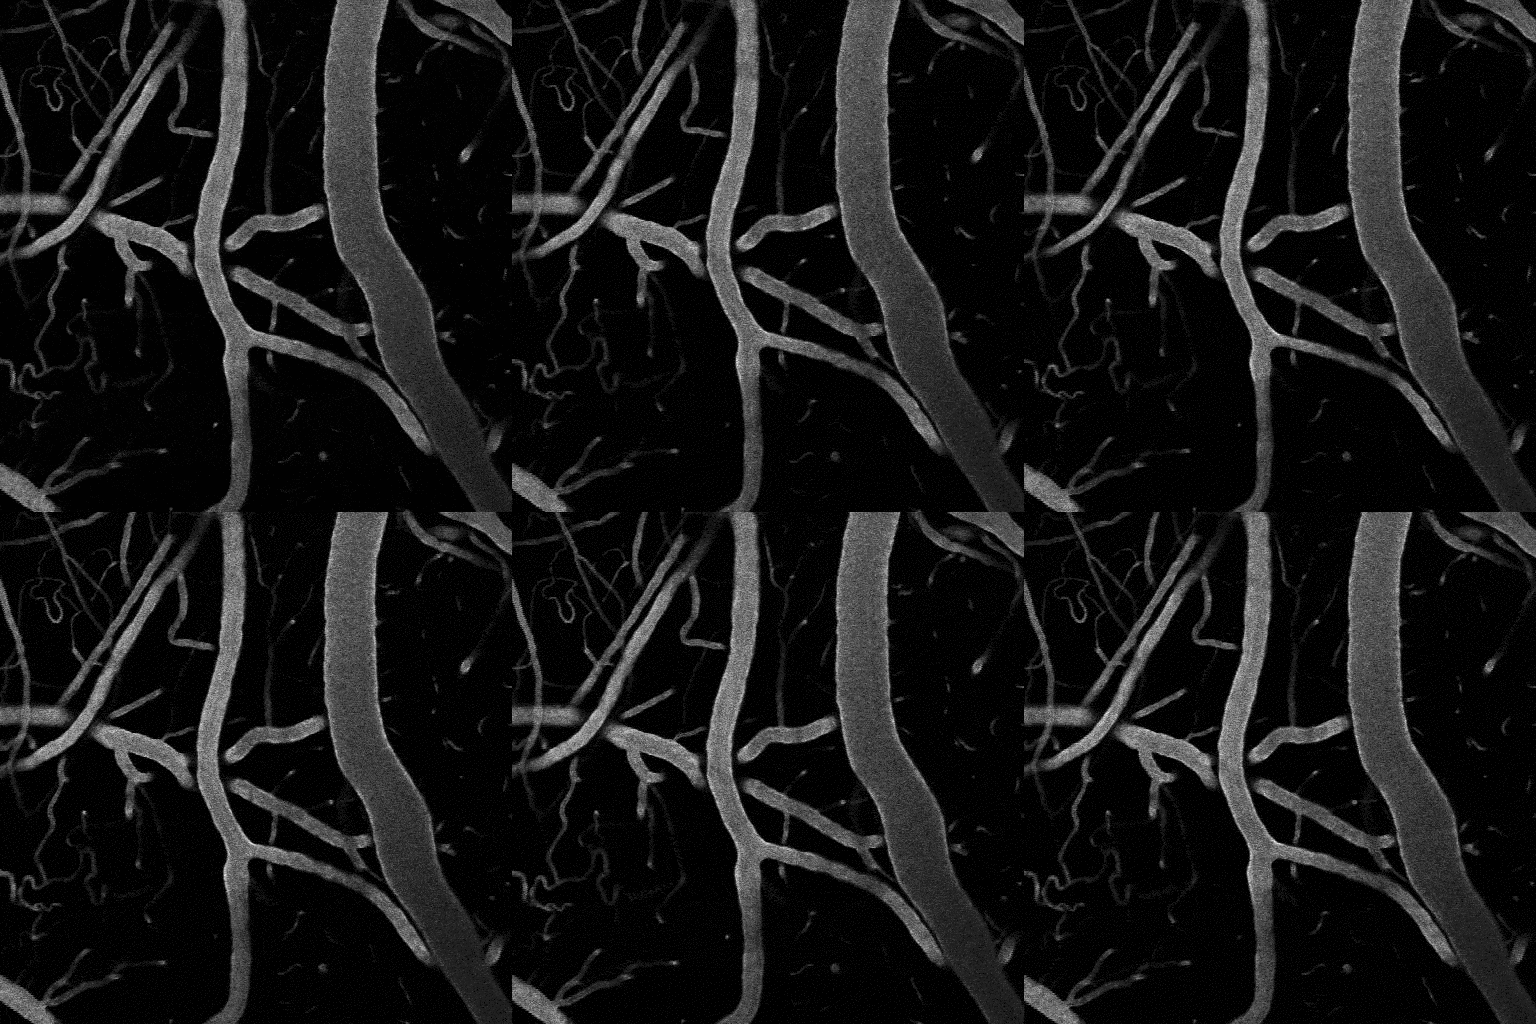
Full-field activation with the 594 nm LED in a PDGFRB/ReaChR mouse. Image is looking down at pial surface vessels in the neocortex labeled with FITC dextran. A single 100 ms pulse from the 549 nm LED was used to stimulate the vessels. The dark flash indicates the time of the optical stimulation. The image darkens because the detectors are briefly blocked by mechanical shutters to protect them from the intense stimulation light. Speed 4x real time. Data courtesy of Phil O'Herron, University of Augusta, Augusta, GA. Image Credit: Bruker Nano Surfaces and Metrology
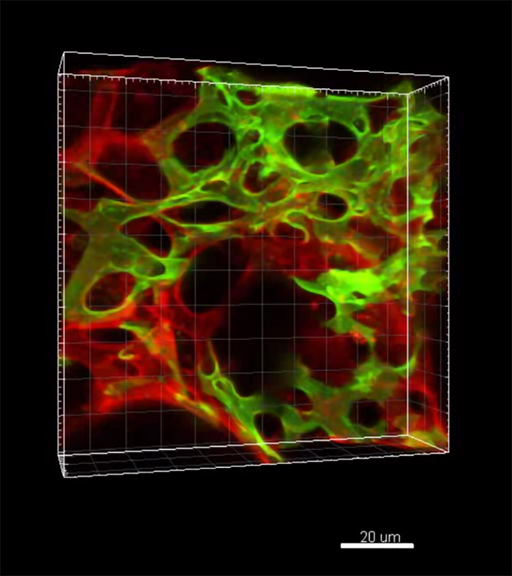
EGFP-expressing dendritic epidermal T cells (green) in the skin of a mouse. Intravenously injected Rhodamin 6G demarcates the dermal-epidermal border (red). Hair shafts (purple) are rooted in hair follicles revealed by their sebaceous glands (blue autofluorescence). Data courtesy of Dr. Thorsten Mempel, MGH Harvard. Image Credit: Bruker Nano Surfaces and Metrology
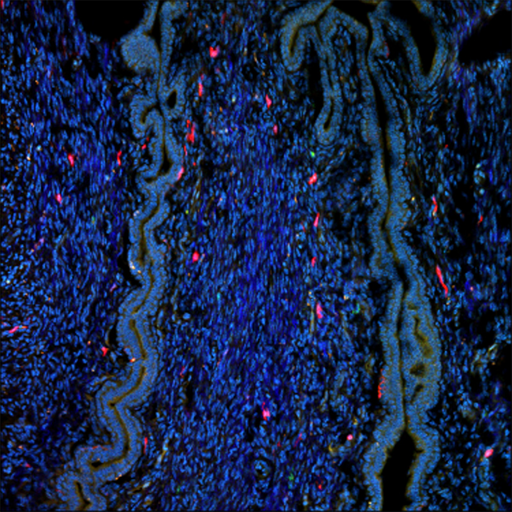
mCherry-expressing dendritic cells (red) in the female genital tract of a CD11c-mCherry transgenic reporter mouse. The animal was intravenously injected with Hoechst 33342 to stain all nucleated cells (blue). The epithelial cells were visualized with an autofluorescence signal (green/turquoise hue). Data courtesy of Dr. Thorsten Mempel, MGH Harvard. Image Credit: Bruker Nano Surfaces and Metrology
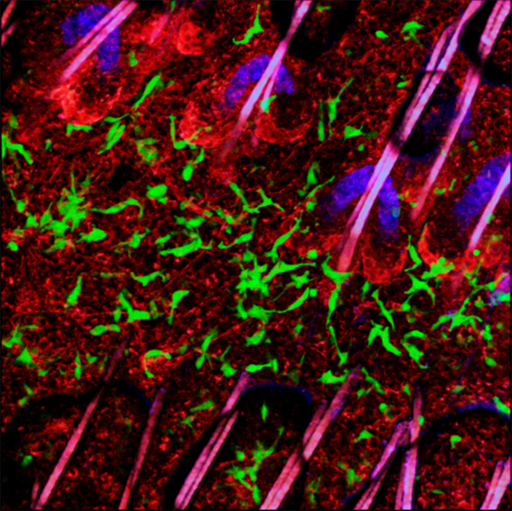
EGFP-expressing dendritic epidermal T cells (green) in the skin of a mouse. Intravenously injected Rhodamin 6G demarcates the dermal-epidermal border (red). Hair shafts (purple) are rooted in hair follicles revealed by their sebaceous glands (blue autofluorescence). Data courtesy of Dr. Thorsten Mempel, MGH Harvard. Image Credit: Bruker Nano Surfaces and Metrology
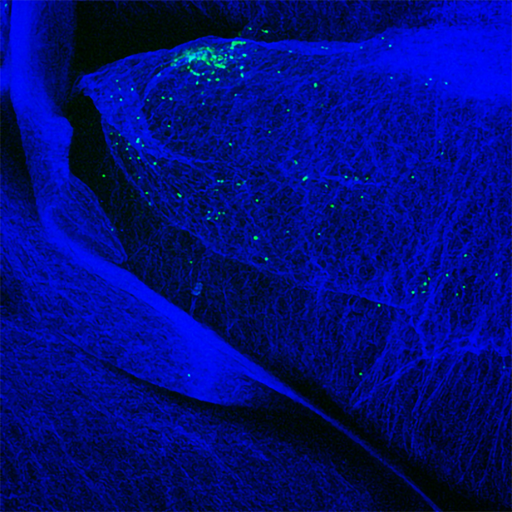
GFP-expressing T cells (green) accumulating around a pancreatic islet in a mouse developing autoimmune pancreatitis, ultimately leading to diabetes. Data courtesy of Dr. Thorsten Mempel, MGH Harvard. Image Credit: Bruker Nano Surfaces and Metrology
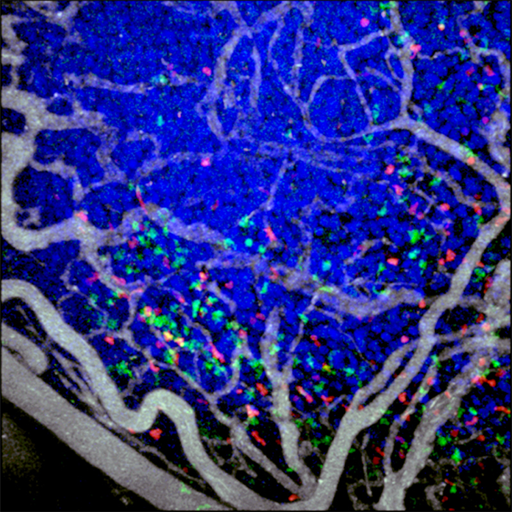
GFP-expressing cytotoxic T lymphocytes (green) and tdTomato-expressing regulatory T cells (red) infiltrating a mouse colon carcinoma implanted into a dorsal skinfold chamber. Tumor cell nuclei (blue) are tagged through expression of a Cerulean-histone H2B fusion protein. Blood vessels (white) are highlighted through intravenous injection of QTracker 655 quantum dots. Data courtesy of Dr. Thorsten Mempel, MGH Harvard. Image Credit: Bruker Nano Surfaces and Metrology
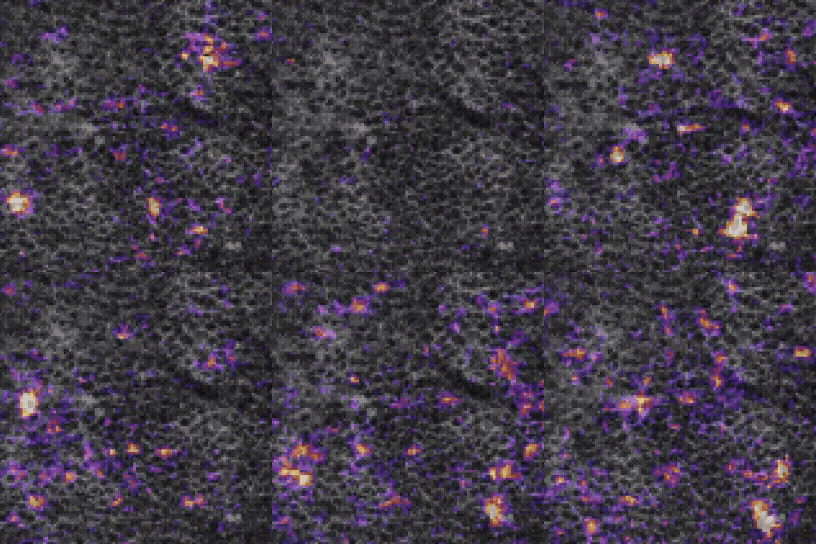
OptoVolt 8x mode (550 Hz) showing two-photon imaging of Hippocampal CA1 neurons expressing the voltage indicator FORCE1s, playing at 0.1x speed. Delta F/F in color with anatomical overlay in gray. Image Credit: Bruker Nano Surfaces and Metrology
Specifications
Select Ultima 2Pplus Specifications
Source: Bruker Nano Surfaces and Metrology
| SCAN HEAD |
| Scanning Method |
Matched pair of 6 mm Cambridge galvanometers with raster and spiral scanning capabilities |
| Field of View |
~ 1.375 mm x 1.375 mm with 16x objective (≤ 28 mm FN) |
| Scan Speed |
Raster scan: 1.65 fps at 512 x 512, > 12 fps at 64
Spiral scan: 6 fps at 512 x 512, ~ 30 fps at 64 x 64 |
| Scan Customization |
User-definable straight, freehand, and circular (infinite) linescan with included software; user-definable pixels/line and lines/scan from 1 to 2048; ≤ 120x scan zoom; 360 ° of scan rotation; point scan |
| Uncaging Option |
A second set of matched 3 mm or 6 mm Cambridge galvanometers in the same scan head provides high-precision visible or multiphoton laser sample photomanipulation |
| High-Speed Imaging Option |
8 kHz resonant galvanometer; ~ 30 fps at 512 x 512, > 1300 fps at 512 x 8 region of interest |
| DETECTORS |
| Reflected Non-Descanned |
One to four hand-picked Hamamatsu Multi-Alkali PMTs; upgradeable to high-sensitivity Hamamatsu GaAsP PMTs |
| Transmitted Non-Descanned |
One or two hand-picked Hamamatsu Multi-Alkali PMTs; upgradeable to high-sensitivity Hamamatsu GaAsP PMTs |
| Dodt |
Single Hamamatsu PMT for DIC-like image collection |
| Transmitted |
Single Hamamatsu PMT for transmitted light image collection |
| Camera |
Standard C-mount camera port built into the scan head |
| OPTICAL INPUTS |
| Multiphoton Laser |
Optimized for multiphoton laser input from 690 to 1700 nm |
| Epifluorescence |
High-powered LED in epifluorescence turret |
| Visible Laser |
Fibered laser inputs for visible laser introduction |
| Ultima Laser Rating |
Class 1 (Contains Class 3b and Class 4 lasers) with light box |
| Helios Laser Rating |
Class 3b |
| LED |
Full-field photoactivation with LED module |
| MOTOR CONTROL |
| Bruker X, Y Stage |
Variable height with ~ 15 cm X and ~ 7.5 cm Y movement and ~ 0.3 μm step size |
| Bruker X, Y Microscope Base |
Fine and coarse-movement platform for scope with ~ 35 mm travel and 0.1 μm step size |
| Bruker Z-Focus |
Range of 30 mm with ~ 0.2 μm step size |
| Bruker Z-Piezo |
Travel range ≤ 1000 μm with a 0.05 μm step size |
| Bruker Orbital Nosepiece |
Motorized control of objective angle and rotation |
| SOFTWARE |
| Prairie View Imaging |
Turnkey intuitive and customizable operation for imaging |
| Z-Series |
Easy creation of depth stacks with user-customizable slice number, step size, and laser power |
| T-Series |
Easy creation of complex series involving Z-Series and triggered images |
| Stage Montage |
Atlas Imaging simplifies setup and optimizes acquisition of 2D and 3D stage montages |
| Peripherals Integration |
Wavelength and power control available for multiphoton and visible laser launches |
| Photoactivation |
User-defined points and regions with synchronized laser modulation |
| Regions of Interest |
User-defined regions for faster scanning capabilities |
| Brightness Over Time |
Intensity mapping and plotting for user-defined regions over time |
| Voltage Inputs/Outputs |
Signal inputs and outputs for electrophysiological experiments, stimulus control, and synchronization with external devices |