Improving the accuracy of forecasting drug safety in non-clinical settings is achieved through the utilization of three-dimensional (3D) cellular models. The advancement of 3D bioprinting technology facilitates the creation of intricate models, offering precise spatial control and diverse matrices, thereby facilitating the development of elaborate tissue structures.
This article will explore a technique for the automated generation of 3D cellular liver models using a multi-tool robotic device with liquid handling. This method was used for compound testing and toxicity effect evaluation in liver cells. In the example discussed here, the researchers were able to automate bioprinting and high-content imaging of liver cells within a collagen matrix.
For instance, in an assay using bio-printed structures, HepG2 cells were suspended in collagen I containing micro-structure printed channels, facilitating improved diffusion of media. A robotic system utilized a printing tool and pipettor to deposit pluronic acid into designated wells of a multi-well plate, establishing the necessary 3D structures for channel formation. Subsequently, the system dispensed a mixture of cells and collagen to construct a dense 3D cell layer.
Advantages:
- cGMP and user-friendly interface for accessible building of complex organ-specific models.
- Consistent 3D bioprinting and dispensing with flexible built-in assays and multiple customizable tools.
- Long-period monitoring and high-content imaging for 3D cellular models.
Materials
BAB400
The BioAssemblyBot® 400 (BAB400), developed by Advanced Solutions, represents a cGMP-certified versatile platform with multiple tools for constructing 3D models.
Employing the tissue structure information modeling (TSIM) software, users can design intricate 3D structures tailored for 3D printing utilizing the ambient tool and Bioapps Maker. Furthermore, this system facilitates the automation of dispensing, imaging, and maintenance processes for the 3D models.
ImageXpress Micro Confocal System (Imaging)
Transmitted light (TL) and fluorescent images were captured utilizing the ImageXpress® Micro Confocal High-Content Imaging System developed by Molecular Devices, in conjunction with the MetaXpress® High-Content Image Acquisition and Analysis Software.
Z-stack images of liver tissue models were obtained using confocal mode with either 4X or 10X objectives. All subsequent analyses were performed using the MetaXpress software.
Printing and Cell Model Preparation
HepG2 human liver cancer cell line cells were cultured according to the ATCC protocol, with equipment enabling media addition, exchanges, and collection. Subsequently, utilizing the ambient 3D print tool, hexagonally arranged Pluronic pillars were generated.
Following this, the cells were detached from the plate surface, centrifuged, and combined with collagen media (2 mg/mL) to achieve a concentration of 20 million cells/mL after the pluronic pillar arrays were printed and warmed to 37 °C for 30 minutes in an incubator.
50 μL of the collagen/cell suspension at 8 °C was then introduced to the wells with pillars. The pillars were then removed using temperature-based dissolution and washed twice with the pipette tool. The end result was a structured, cell-dense, 3D liver cell construct.
The 3D HepG2 models underwent daily monitoring via transmitted light imaging during the culture period. Subsequently, these models were subjected to treatment with a selection of drugs known for their liver toxicity, which included chloroquine, haloperidol, pimozide, taxol, doxorubicin, cisplatin, and mitomycin.
This treatment occurred on day four of model formation, and 48 hours later, imaging was performed. Cells were stained with viability dyes, and a confocal imaging system was used for imaging and endpoint measurements.
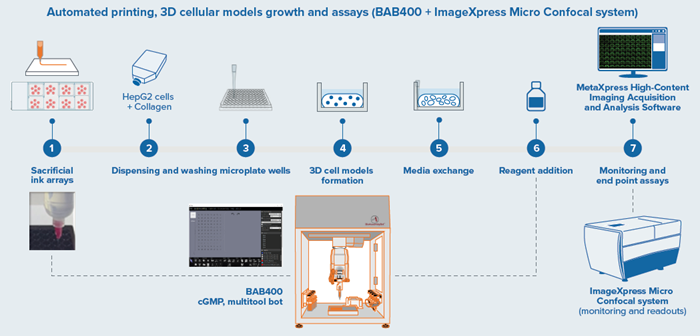
Figure 1. BAB400 3D printing and dispensing workflow integrated with Imager for endpoint assays. Image Credit: Molecular Devices UK Ltd
Results
Culture of HepG2 Cell Models
The BAB400, leveraging TSIM design software, effectively generated HepG2 cell models in 96-well formats, as depicted in Figure 2.
Array patterns in the 96-well plate format were designed using TSIM software, printed, and seeded with cells mixed in collagen I. Subsequently, these models were monitored for four days before undergoing additional drug treatments and imaging procedures.
Drug Treatment and Imaging
Multiple 96-well plates were observed up until the fourth day and subsequently treated with various drugs for a period of 48 hours. The cells were then stained for live and dead counts and studied to obtain viability data.
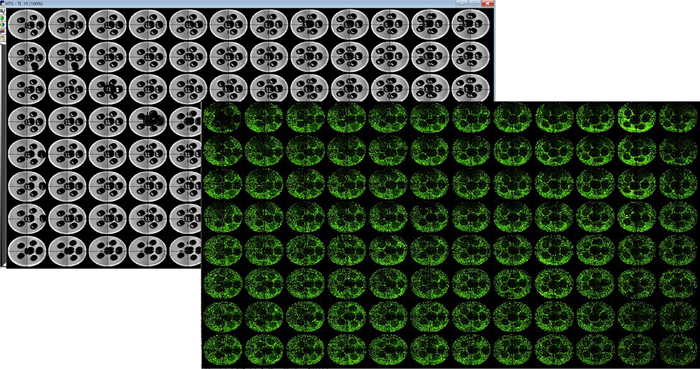
Figure 2. TL image of 3D printed pluronic pillar arrays captured using ImageXpress Micro Confocal system (4X) (left–grey panel). Plate representations of uniformly seeded HepG2 cells in collagen I after pluronic pillars were washed (right – green panel). The holes in the dense collagen matrix enabled for better exchange of nutrients and gases. This eventually prevents the cells in the center of the matrix from undergoing necrosis. Image Credit: Molecular Devices UK Ltd
After drug treatment on the fourth day of observation, the cells were stained to distinguish between live and dead cells, and subsequently analyzed to gather viability data.
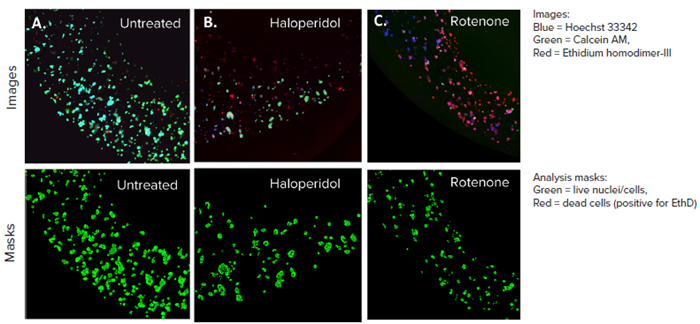
Figure 3. HepG2 3D cell model confocal images, 4X single site image (top panel), and their representative live analysis masks generated by MetaXpress software (bottom panel) A) Untreated control, B) Haloperidol (20 μM), C) Rotenone (4 μM). The control wells had more HepG2 cells and lower cell death whereas, the treated cells had more red-stained cells and a lower number of live cells, indicating cell death. Image Credit: Molecular Devices UK Ltd
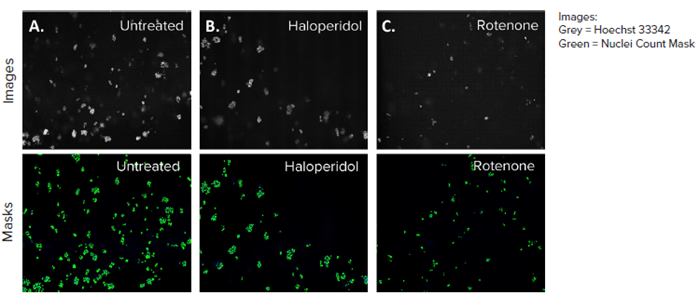
Figure 4. HepG2 3D cell model DAPI images, 10X single site image (top panel), and their representative nuclei count analysis masks generated by MetaXpress software (bottom panel) A) Untreated control, B) Haloperidol (4 μM), C) Rotenone (4 μM). The DAPI mask counted the number of nuclei present in each site and the control (A) had the most nuclei owing to no toxicity. Image Credit: Molecular Devices UK Ltd
Drug Response and Imaging Data
The same drug treatments were also performed on 2D HepG2 cultures, and the difference in dose-response between the 3D HepG2 cell models was compared. One crucial finding was that the compound effects were observed at lower concentrations in the 2D systems compared to 3D systems.
The models were imaged using confocal microscopy at both 4x and 10x magnifications, and projection images were then subjected to live-dead analysis. For image analysis, the Custom Module Editor within the MetaXpress software was utilized, allowing for the identification of cells, subcellular structures, and responses to treatments.
The entire workflow can be automated using the BAB400 BioApps Player solution. Figure 5 showcases a composite image featuring three stains: Calcein AM, Ethidium homodimer – III (EthD), and Hoechst 33342.
These images provide an overview of all wells, where control wells exhibit brighter green stains and fewer red stains, indicating higher numbers of live cells and fewer dead cells. The effects of the compounds led to increased EthD uptake, reflecting a cell death phenotype.
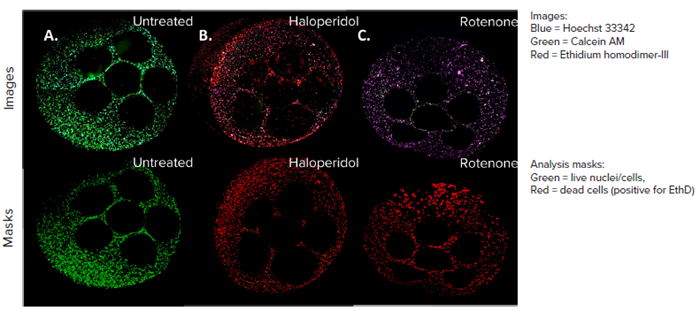
Figure 5. HepG2 cell model confocal images, 4X all sites image (top panel), and their representative live dead analysis masks generated by MetaXpress software (bottom panel). A) Untreated control, B) Haloperidol (100 µM), C) Rotenone (100 µM). Image Credit: Molecular Devices UK Ltd
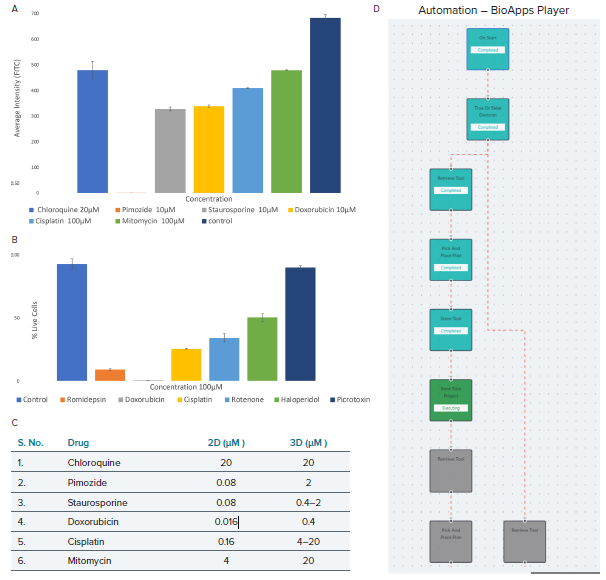
Figure 6. The HepG2 cell model projection images were analyzed using live-dead analysis. A) The average intensity of fluorescence against the various drug dose effects (seeding density 7 million cells/mL). B) Live cell percentage of treated cell models against the highest dose of drugs, i.e., 100 μM and cell seeding density of 20 million cells/mL. C) Comparison between the 2D and 3D HepG2 cell models indicating the minimum dosage in μM required for phenotypic response. D) BioApps Player workflow for a basic print workflow which allows for full automation. Image Credit: Molecular Devices UK Ltd
Summary
A comparison between 2D and 3D HepG2 assays highlighted compound effects at lower concentrations in 2D systems compared to 3D, underscoring disparities in compound responses between the two assay formats.
The limitations associated with using HepG2 cells for toxicity assessment stem from their continuous proliferation in culture. Consequently, many observed effects are predominantly associated with anti-proliferative compounds. Utilizing non-proliferating primary or iPSC-derived liver cells would offer a more predictive model for evaluating toxicity effects in the liver.
Conclusions
The results presented in this article underpin the importance of generating liver 3D bio-printed models through automated methods. The results also highlight the advantages of using imaging and data analysis techniques in combination with descriptors to gain deeper insights into the intricate compound effects within 3D-printed and cell-tissue-engineered models.
Enhancements in accuracy and throughput can be attained through automation. The process discussed here can be fully automated by integrating several instruments to provide automated cell culture, maintenance and differentiation of 3D cellular models. These can then be used for compound screening in a variety of assays.
Acknowledgments
Produced from materials originally authored by Prathyushakrishna Macha and Oksana Sirenko from Molecular Devices LLC and Sarah M. Moss and James B. Hoying from Advanced Solutions Life Sciences.
About Molecular Devices UK Ltd 
Molecular Devices is one of the world’s leading providers of high-performance life science technology. We make advanced scientific discovery possible for academia, pharma, and biotech customers with platforms for high-throughput screening, genomic and cellular analysis, colony selection and microplate detection. From cancer to COVID-19, we've contributed to scientific breakthroughs described in over 230,000 peer-reviewed publications.
Over 160,000 of our innovative solutions are incorporated into laboratories worldwide, enabling scientists to improve productivity and effectiveness – ultimately accelerating research and the development of new therapeutics. Molecular Devices is headquartered in Silicon Valley, Calif., with best-in-class teams around the globe. Over 1,000 associates are guided by our diverse leadership team and female president that prioritize a culture of collaboration, engagement, diversity, and inclusion.
To learn more about how Molecular Devices helps fast-track scientific discovery, visit www.moleculardevices.com.
Sponsored Content Policy: AZO Life Sciences publishes articles and related content that may be derived from sources where we have existing commercial relationships, provided such content adds value to the core editorial ethos of News-Medical.Net which is to educate and inform site visitors interested in medical research, science, medical devices and treatments.