Why do some people with obesity develop type 2 diabetes while others remain metabolically healthy? A closer look at the cellular landscape of abdominal fat reveals striking differences that could open new avenues for treatment.
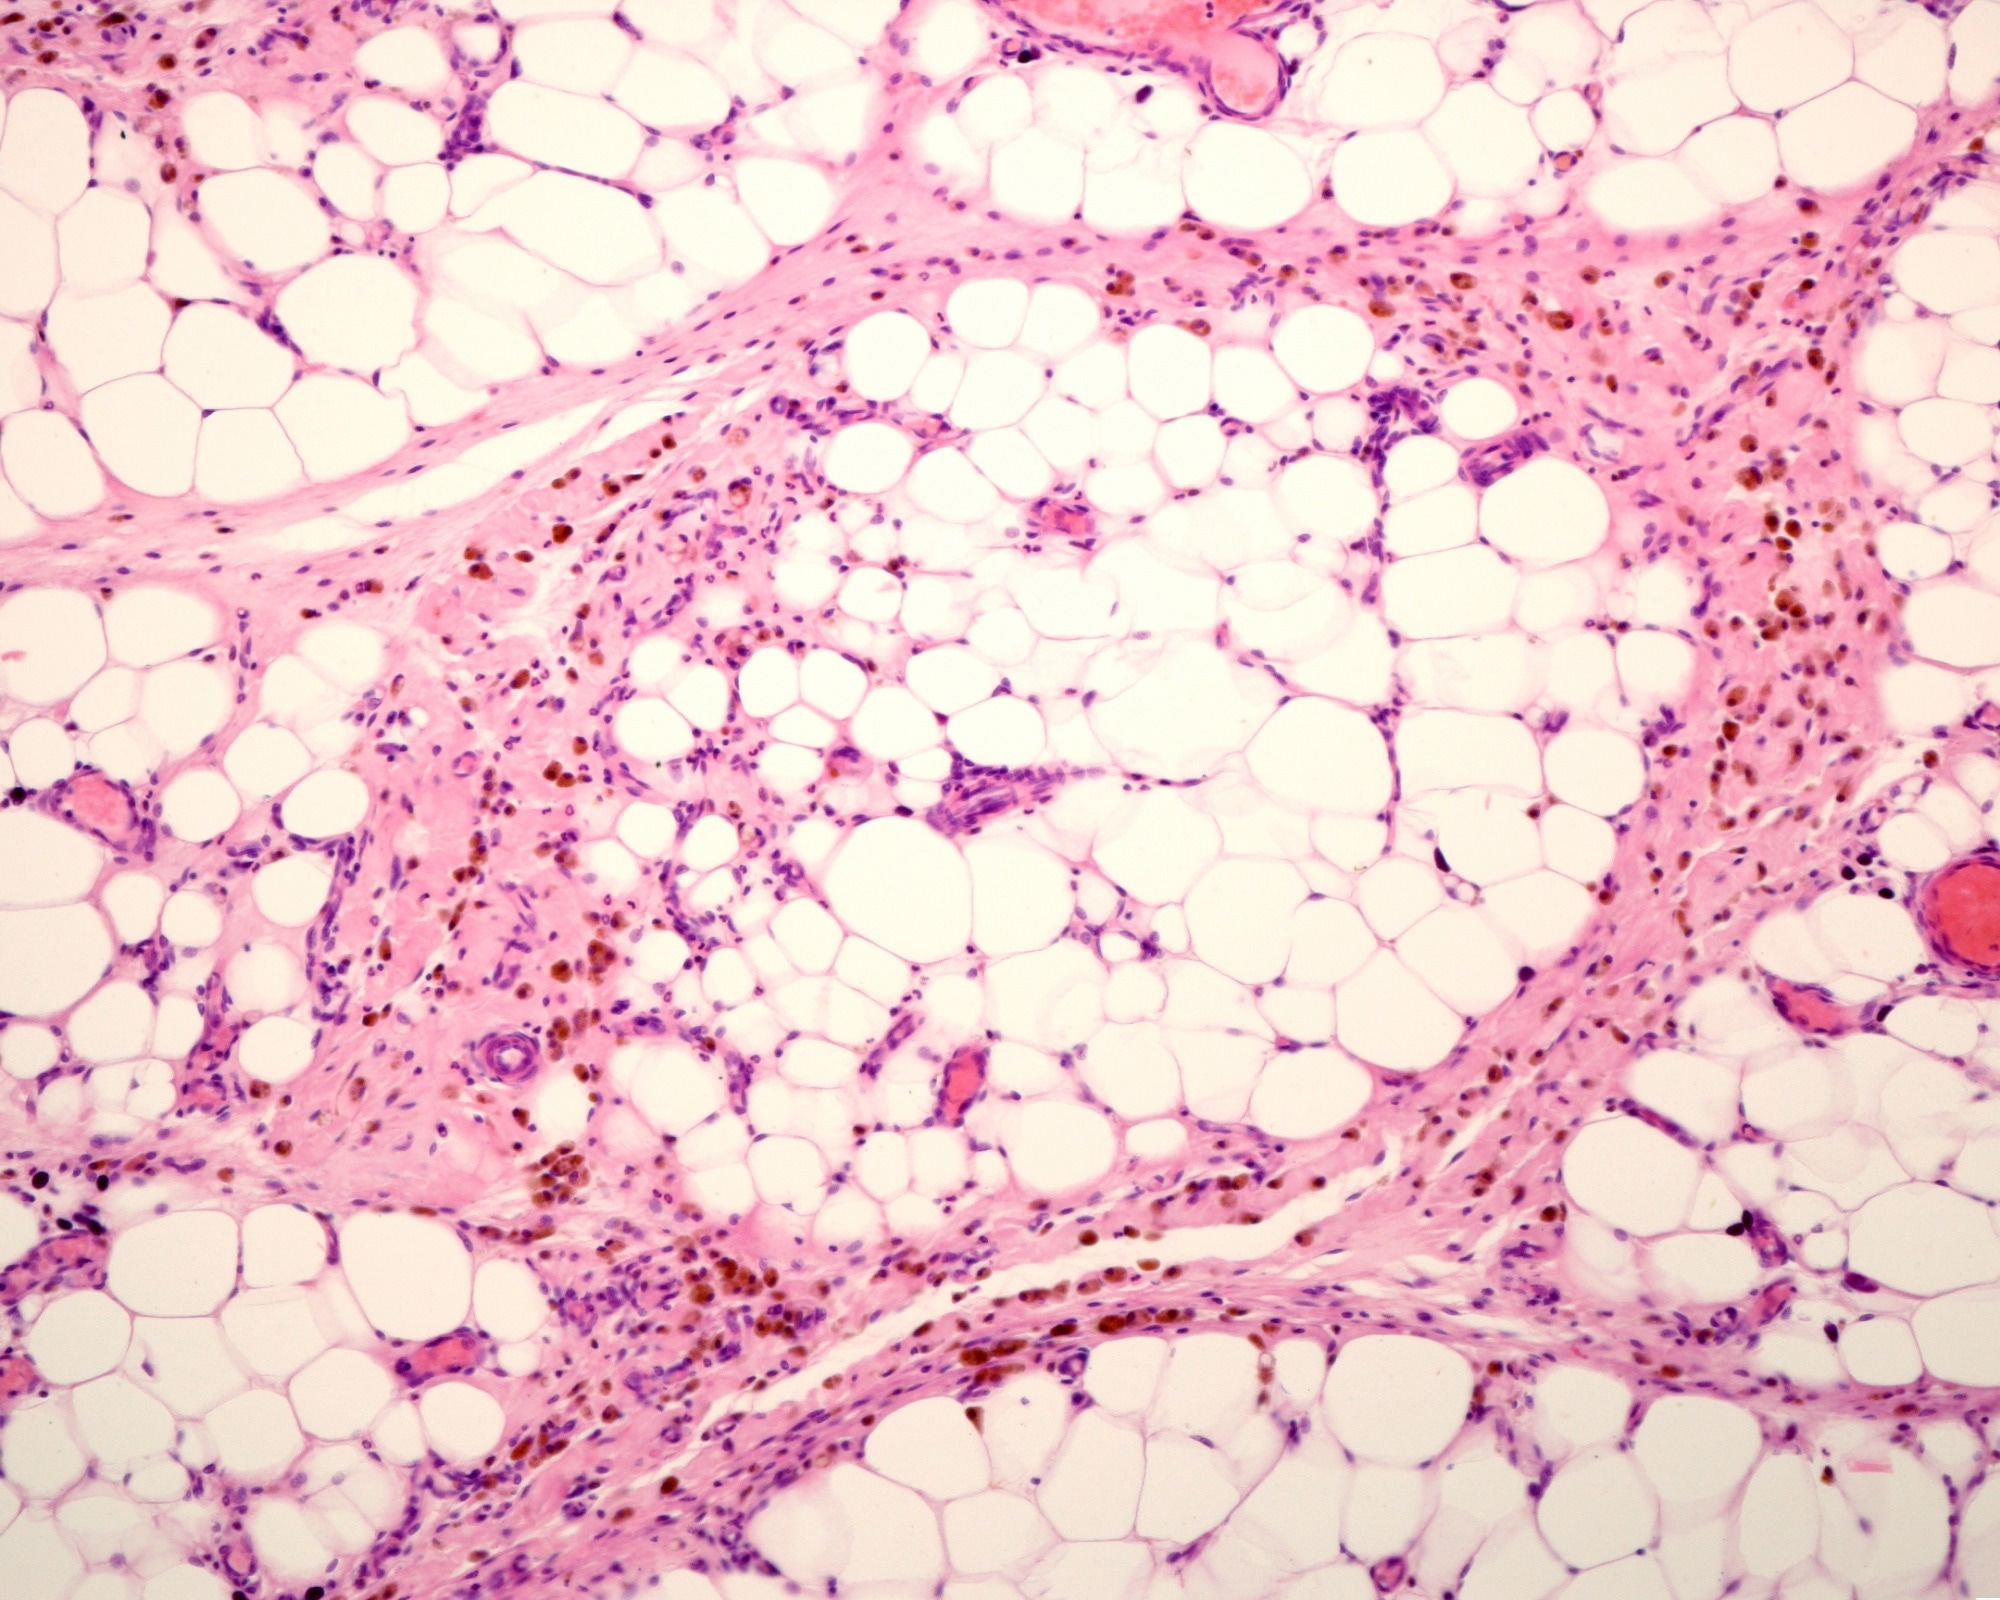 Study: A transcriptional and cellular exploration of obesity and type II diabetes in human adipose tissues. Image credit: Jose Luis Calvo/Shutterstock.com
Although obesity is a major risk factor for cardiovascular disease, various types of cancers, and type 2 diabetes, about 10–35% of adults with obesity show no hallmarks of metabolic disease. In a recent study published in Science Advances, researchers compared fat tissue from patients with obesity, with and without diabetes, to explore the biological differences associated with type 2 diabetes.
Understanding Why Obesity Does Not Always Lead to Diabetes
Obesity affects more than one billion adults and contributes to cardiovascular disease, type 2 diabetes, and 13 types of cancers. Yet an estimated 10–35% of people with obesity show no signs of metabolic disease. They tend to have lower systemic inflammation, lower blood sugar, and greater insulin sensitivity. The factors that contribute to this protection against type 2 diabetes remain unclear.
Fat tissue acts as a regulatory organ that communicates with the whole body, and it behaves differently by location. Subcutaneous fat beneath the skin and omental fat, a type of visceral fat located around abdominal organs, influence health in distinct ways. Research has thus far focused on metabolically healthy versus unhealthy obesity, and comparatively little is known about the specific changes in fat tissue associated with type 2 diabetes.
Comparing Fat Tissue With and Without Type 2 Diabetes
In this study, the research team recruited 58 adults with obesity who were scheduled for elective weight loss or bariatric surgery at two hospitals in Dublin, Ireland, between July 2020 and June 2021. Those with a clinical diagnosis of type 2 diabetes and a glycated hemoglobin (HbA1c) level of at least 5.7% formed one group, and the remainder formed the comparison group without diagnosed type 2 diabetes.
During surgery, the team collected paired samples of subcutaneous and omental fat from each person, along with blood. Body measurements and fasting blood tests, covering sugar, insulin, and blood fats, were also gathered.
Fat tissue samples from ten patients, five per group and matched for age and body mass index, underwent single-cell ribonucleic acid (RNA) sequencing. Immune and nonimmune cells were sorted and pooled in equal numbers before sequencing, and cell types were identified by comparison with published datasets and the Human Cell Atlas.
For a subset of 42 patients, flow cytometry was used to assess immune cells in fat and blood. The cells were examined at rest and after four hours of chemical stimulation to test inflammatory capacity. In separate experiments, cells from omental fat, including macrophages, were also exposed to molecules that mimic infection to measure their responses. Fat samples from 17 patients were examined under the microscope to measure fat cell size, and blood serum from 35 patients was tested for signaling proteins called cytokines and chemokines.
The team used statistical methods to identify patterns across more than 800 flow cytometry measurements. They then tested how type 2 diabetes, high blood pressure, and abnormal blood fats were associated with immune cell characteristics, individually and in combination, while also exploring the roles of age, sex, and body size. Computational tools were also used to infer how different cells in each tissue communicate.
Diabetes-Associated Inflammation Differs Across Fat Tissue Locations
The study found that type 2 diabetes was associated with more pronounced changes in omental fat than in subcutaneous fat, with the strongest changes arising in supportive, nonimmune cells. Participants in the diabetes group not only had 1.5-fold higher fasting glucose and HbA1c, but their triglycerides were 1.6-fold higher, while their protective high-density lipoprotein (HDL) cholesterol levels were lower.
Mesothelial cells, which line the surface of omental fat, were more abundant in the diabetes group and showed the largest gene activity changes. These cells and a related population that were positive for insulin-like growth factor-binding protein 2 (IGFBP2) showed a shift toward metabolic stress and fibrotic tissue remodeling, with gene activity favoring scar-like tissue formation over the development of new fat cells.
Furthermore, endothelial cells in omental fat accumulated more lipids, showed a more inflammatory profile, and displayed greater levels of molecules involved in antigen presentation to immune cells. Omental macrophages also produced less of the inflammatory proteins interferon gamma and interleukin 6 when stimulated, and omental fat had more eosinophils.
Moreover, innate T cells in omental fat generally showed weaker inflammatory responses after stimulation, whereas those in subcutaneous fat responded more strongly. Subcutaneous fat also contained more macrophages and showed stronger signaling associated with the recruitment of natural killer and T cells, while its fat cell precursors showed better-preserved gene activity associated with the formation of new fat cells. The size of the fat cells did not differ significantly between groups, even though gene activity in precursor cells did.
The results suggested that specific combinations of coexisting conditions were more important in shaping immune cell patterns than the number of conditions alone. Circulating levels of the chemokine eotaxin were higher in the diabetes group, and differences in omental T cell abundance between groups were particularly evident in men. The study indicated the potential for targeting these cellular networks in future therapies.
Fat Tissue Changes Reveal Potential Diabetes Treatment Targets
In summary, the study reported that type 2 diabetes in people with obesity was associated with changes in fat tissue in a depot-specific manner, with omental fat showing the most pronounced reprogramming of supportive cells and immune responses. These cellular and signaling differences offered a detailed reference map of the metabolic changes associated with type 2 diabetes in human tissue.
The findings also pointed to candidate targets for future therapies, although larger studies are needed to confirm these findings and determine whether the cellular changes contribute to diabetes development or arise as a consequence of the disease.
Journal Reference
Trim, W. V., Petrova, K., Healy, K., Stevens, B. M., Scanlan, J. G., Faust, H. J., Svensson Akusjärvi, S., O’Brien, K. L., O’Shea, D., Brenner, M. B., Heneghan, H., & Lynch, L. (2026). A transcriptional and cellular exploration of obesity and type II diabetes in human adipose tissues. Science Advances, 12(45), eaee1641. DOI: 10.1126/sciadv.aee1641 https://www.science.org/doi/10.1126/sciadv.aee1641
 Ancient Gut Microbes Traveled Globally With Prehistoric Human Ancestors